Global M2 Money Supply Top20 + Offset & WaveThe M2 Top20 is a global aggregation of the M2 money supply from the 20 largest economies in the world , providing a comprehensive view of the total liquidity in the global financial system. It is expressed in trillions of USD.
This script calculates and visualizes the M2 Money Supply of the Top 20 Global Economies, adjusted to various timeframes (4H, 1D, 1W, 1M) with customizable offset adjustments (in days) from -1000 days to +1000 days. This indicator includes data from the Americas, Europe, Africa, and the Asia Middle East , offering a diverse and balanced representation of major economic regions. The M2 of each country has been converted to USD.
Additionally, the user can set a minimum and maximum offset to create a wave around the main offset and expand the comparison.
Combining these options, this indicator enables users to visualize a range of the global money supply, making it useful for market analysis, economic forecasting, and understanding macroeconomic trends. This indicator is particularly valuable for traders and analysts interested in understanding the dynamics of global monetary systems and their potential impact on financial markets.
Key Features:
Global M2 Money Supply calculation from the Top 20 Economies.
Adjustable Offset: Adjust the offset to align the indicator with the best bar. Adjustment in days, usable on different timeframes (1D, 1W, 4H, 1M).
Wave Projection: Displays a "probability cloud"—a smoothed area that shows the probable path of Bitcoin, derived from shifts in global liquidity.
Min/Max Offset Adjustments: Customizable offsets allow you to determine the range of future windows, helping to shape the wave and better identify liquidity-driven turning points.
Use Cases:
Economic Forecasting: Identify trends in global money supply and their potential market impact (e.g., historically leads Bitcoin price by +/- 78 days to +/-108 days).
Market Analysis: Track the growth or contraction of money supply across key economies.
Macro-Economic Analysis: Understand the relationship between monetary policies and market performance.
How to use:
Add the indicator to your chart.
Set the timeframe to 1D to customize the offset.
Set the Offset (in days).
Set the Offset Range Minimum and Maximum.
Show/Hide the Range Wave
.
Use offset = 0 to have the indicator align directly with the current data, without any shift, providing a baseline for comparison with the most recent market conditions.
Countries included in the M2 Top20:
China (CN), Japan (JP), South Korea (KR), Hong Kong (HK), Taiwan (TW), India (IN), Saudi Arabia (SA), Thailand (TH), Vietnam (VN), United Arab Emirates (AE), Malawi (MW) – Africa, United States (US), Canada (CA), Brazil (BR), Mexico (MX), Eurozone (EU), United Kingdom (GB), Russia (RU), Poland (PL), Switzerland (CH).
These countries were selected from the ranking of the World Economy Indicator of Trading View .
Volume

Volumen Mejorado con EficienciaThis indicator displays each candle's volume in an enhanced visual form, combining the amount of volume with the efficiency of the price movement.
Each volume bar changes its color intensity based on:
Higher efficiency (large price movement with low volume) → stronger color.
Lower efficiency (high volume with little price movement) → weaker color.
Additionally:
Green: Bullish candles (close > open).
Red: Bearish candles (close < open).
The color reflects not only the volume but also how "easily" the price moved.
The efficiency calculation is based on the actual body movement of the candle (abs(close - open)) divided by the total volume, dynamically adjusted to the maximum efficiency over the last N candles (configurable).
Interpretation:
Intensely green or red volume bars: clean and efficient movements (low resistance).
Pale bars: market absorption or indecision (high volume but little price movement).
Configurable parameter:
Efficiency period: number of candles used to normalise the maximum efficiency.

Basic FVG Detector - RacesTradesAs the title suggests - nice simple FVG detector - Created by RaceTrades, follow on X

Multi-Indicator Swing [TIAMATCRYPTO]This strategy uses a combination of seven powerful technical indicators to identify potential buy and sell signals for swing trading. By requiring confirmation from multiple indicators, the strategy aims to filter out false signals and capture meaningful price movements.
Indicators Used
EMA Crossover - Fast and slow exponential moving averages to identify trend direction
MACD - Momentum indicator showing the relationship between two moving averages
RSI - Measures speed and change of price movements to identify overbought/oversold conditions
Parabolic SAR - Identifies potential reversal points in price movement
Supertrend - Combines trend and volatility to generate clear buy/sell signals
ADX - Measures trend strength to filter out low-conviction signals
Liquidity Delta - Analyzes bid/ask volume imbalances to detect potential market direction
Usage Recommendations
Timeframe Selection: This strategy works best on 1-hour to daily timeframes for swing trading
Market Application: Most effective in trending markets with clear directional bias
Optimization: Test different indicator combinations to find what works best for specific markets
Risk Management: Consider adding stop-loss and take-profit levels based on your risk tolerance
Notes
The strategy uses a clean interface that displays only buy/sell signals for clearer chart analysis
An information panel shows active indicators and testing period
All calculations are performed even for disabled indicators but they won't affect signal generation
The backtesting period can be adjusted according to your analysis needs
This multi-indicator approach to swing trading aims to provide high-quality signals by requiring confirmation from multiple technical perspectives, potentially reducing false signals and improving overall trading results.

Wyckoff Advanced Swing Strategy by TIAMATCRYPTOStrategy Overview
This custom TradingView strategy combines four powerful trading methodologies - Wyckoff Market Cycles, Price Map Profiling, Mean Reversion, and Trend Following - into a comprehensive swing trading system. It provides extensive customization options and can be tailored for medium to long-term trading positions.
Key Components
1. Wyckoff Analysis
This component focuses on identifying market cycle phases as described by Richard D. Wyckoff:
Accumulation Phase: Identifies periods of smart money accumulation with above-average volume and falling price highs
Markup Phase: Detects strong uptrends with increasing prices supported by volume
Distribution Phase: Recognizes when smart money begins to distribute positions near market tops
Markdown Phase: Identifies downtrends when institutional investors are exiting positions
Special Formations: Detects "spring" patterns (false breakdowns followed by rapid reversals) and "upthrust" patterns (false breakouts)
2. Price Map Profile
Implements a simplified version of Market Profile / Volume Profile concepts:
Calculates Point of Control (POC) - the price level with the highest theoretical activity
Defines Value Area High (VAH) and Value Area Low (VAL) to establish the range where most price action occurs
Visual representation of these key levels to identify potential support and resistance zones
3. Mean Reversion
Identifies potential reversal points when price moves to extremes:
Uses Bollinger Bands to define overbought and oversold price zones
Incorporates RSI divergence to confirm potential reversals
Requires multiple confirmation signals to avoid false entries in strong trends
Employs pattern recognition for higher probability mean reversion trade setups
4. Trend Following
Captures medium to long-term directional price movements:
Utilizes multiple moving averages (9, 21, 50, 200 EMAs) to confirm trend direction and strength
MACD analysis for momentum confirmation and trend intensity
Higher timeframe trend alignment through recent price structure analysis
Requires clear higher highs/higher lows (or lower highs/lower lows) for trade confirmation
Advanced Features
Risk Management
Optional automatic Take Profit and Stop Loss based on ATR (Average True Range)
Trailing stop functionality that adjusts to market volatility
Position sizing as a percentage of equity for proper risk management
Multiple exit strategies based on time, price, or indicator signals
Time-Based Filters
Customizable date range for backtesting historical performance
Trading day filters to avoid entering positions on less favorable days (Fridays/Mondays)
Minimum and maximum holding periods to match swing trading timeframes
Smart exit timing based on market conditions and holding duration
Signal Optimization
Combined signal approach requiring confirmation from multiple systems
Candlestick pattern analysis for enhanced entry timing
RSI-based position exit rules to capture profits at overbought/oversold conditions
Advanced filtering to reduce false signals and avoid low-probability setups
Practical Applications
This strategy is designed for swing traders who:
Hold positions for several days to weeks
Prefer to analyze multiple factors before entering trades
Want to align with institutional money flow through Wyckoff principles
Seek a balance between trend-following and reversal opportunities
Require flexible risk management options
The system works best on daily timeframes for equities, forex, commodities, and cryptocurrency markets with sufficient liquidity. It can be used as a standalone trading system or as a confirmation tool alongside other analysis methods.
Strategy Parameters
All major components can be enabled or disabled independently:
Wyckoff Analysis
Price Map Profiling
Mean Reversion
Trend Following
Risk parameters, timeframes, and technical indicators can be extensively customized to match individual trading preferences, market conditions, and risk tolerance.

BTC Price-Volume Efficiency Z-Score (PVER-Z)Overview:
This PVER-Z Score measures Bitcoin’s price movement efficiency relative to trading volume, normalized using a Z-Score over a long-term 200-day period.
It highlights statistically rare inefficiencies, helping investors spot extreme accumulation and distribution zones for systematic SDCA strategies.
Concept:
- Measures how efficiently price has moved relative to the volume that supported it over a long historical window (Default 200 days) but can be adjustable.
- It compares cumulative price changes vs cumulative volume flow.
- Then normalizes those inefficiencies using Z-Score statistics.
How It Works:
1. Calculates the absolute daily price change divided by volume (price-volume efficiency ratio).
2. Applies EMA smoothing to remove noisy fluctuations.
3. Normalizes the result into a Z-Score to detect statistically significant outliers.
4. Plots dynamic heatmap colors as the efficiency score moves through different deviation zones.
5. Background fills appear when the Z-Score moves beyond ±2 to ±3 SD, signaling rare macro opportunities.
Why is Bitcoin price rising while PVER-Z is falling toward green zone?
1. PVER-Z is not just "price" — it's price change relative to volume. PVER-Z measures how efficient the price movement is relative to volume. It's not "price going up" or "price going down" directly. It's how unusual or inefficient the price versus volume relationship is, compared to its historical average.
2. A rising Bitcoin price + weak efficiency = PVER-Z falls.
If Bitcoin rises but volume is super strong (normal buying volume), no problem, the PVER-Z stays normal. If Bitcoin rises but with very weak volume support, PVER-Z falls.
***Usage Notes***:
- Best used on the daily timeframe or higher.
- When the Z-Score enters the green zone (-2 to -3 SD), it signals a historically rare accumulation zone — favoring long-term buying for SDCA.
- When the Z-Score enters the red zone (+2 to +3 SD), it signals overextended distribution — caution recommended.
- Designed strictly for mean-reversion analysis, no trend-following signals.
- The red zone on a proper Z chart would be -2SD to -3SD and +2SD to +3SD for the green zone. At the time of publishing I do not know how to adjust the values on the indicator itself. The red zone at -2SD is actually +2 Standard Deviations on a Z Score SD Chart. (overbought zone).
- Your green zone at +2SD is actually -2SD Standard Deviations (oversold zone).
- Built manually with no reliance on built-in indicators
- Designed for Bitcoin on the 1D, 3D, or Weekly timeframes. NOT for intraday trading.
- DO NOT SOELY RELY ON THIS INDICATOR FOR YOUR LONG TERM VALUATION. I AM NOT RESPONSIBLE FOR YOUR FINANICAL ASSETS.


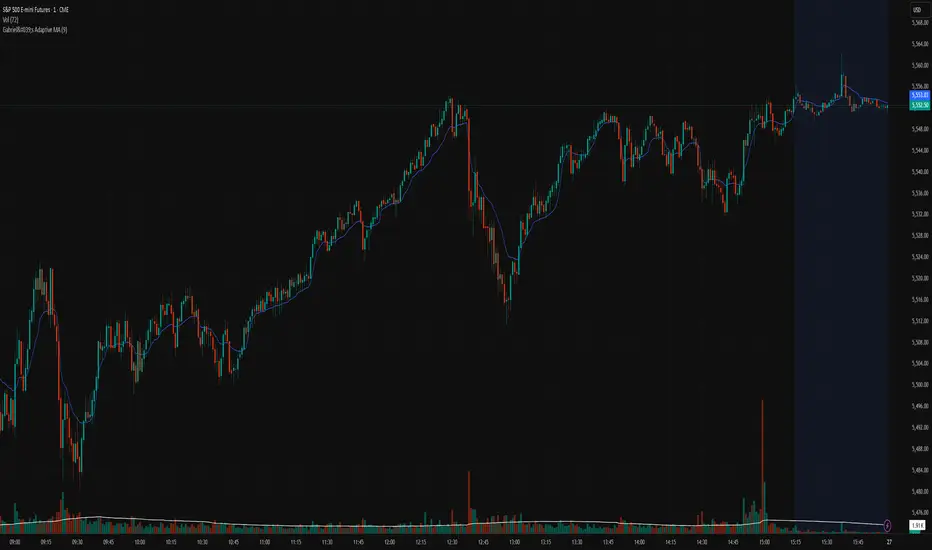
Gabriel's Adaptive MA📜 Gabriel's Adaptive MA — Indicator Description
Gabriel's Adaptive Moving Average (GAMA) is a dynamic trend-following indicator that intelligently adjusts its smoothing based on both trend strength and market volatility.
It is designed to provide faster responsiveness during strong moves while maintaining stability during choppy or consolidating periods.
🧠 What it does:
This indicator plots a custom-built, highly dynamic Moving Average that adapts itself intelligently based on:
Trend Strength (via Perry Kaufman's Efficiency Ratio)
Market Volatility (via Tushar Chande's Volatility Ratio)
It reacts faster when the market is trending strongly and/or highly volatile,
and it smooths out and slows down when the market is choppy or calm.
🔍 How it works (step-by-step):
1. User Inputs:
length: (default 14)
How many bars to look back for calculations.
fastSC: Fastest possible smoothing constant (hardcoded as 2 / (2+1))
slowSC: Slowest possible smoothing constant (hardcoded as 2 / (30+1))
(These are used to control how fast/slow the KAMA can react.)
2. Calculate Trendiness — Kaufman Efficiency Ratio (ER):
Net Change = Absolute difference between current close and close from length bars ago.
Sum of Absolute Changes = Sum of absolute price changes between every bar inside the length window.
Efficiency Ratio (ER) = Net Change divided by Sum of Changes.
✅ If ER is close to 1 → Smooth, trending market.
✅ If ER is close to 0 → Choppy, sideways market.
3. Calculate Bumpiness — Volatility Ratio (VR):
Short-Term Volatility = Standard deviation of close over length.
Long-Term Volatility = Standard deviation of close over length * 2.
Volatility Ratio (VR) = Short-Term Volatility divided by Long-Term Volatility.
✅ If VR is >1 → Market is becoming more volatile recently.
✅ If VR is <1 → Market is calming down.
4. Create the Hybrid Alpha:
Multiply ER × VR.
Then square the result (math.pow(..., 2)).
This hybrid alpha decides how aggressive the MA should be based on both trend and volatility.
If ER and VR are both strong → big alpha → fast movement.
If ER and/or VR are weak → small alpha → slow movement.
5. Calculate the Final Adaptive Smoothing Constant (hybridSC):
hybridSC = slowSC + hybridAlpha × (fastSC - slowSC)
This smoothly interpolates between the slowest and fastest smoothing depending on market conditions.
6. Calculate and Plot the Adaptive MA:
The moving average is manually calculated:
hybridMA := na(hybridMA ) ? close : hybridMA + hybridSC * (close - hybridMA )
It behaves like an EMA but with dynamic smoothing, not a fixed alpha.
✅ If hybridSC is high → MA hugs the price closely.
✅ If hybridSC is low → MA stays smooth and resists noise.
Finally, it plots this Adaptive MA on the chart in blue color.
📊 Visual Summary
Market Type What Happens to GAMA
Trending hard + volatile Follows price quickly
Trending hard + calm Follows steadily but carefully
Sideways + volatile Reacts carefully (won't chase noise)
Sideways + calm Smooths heavily (avoids fakeouts)
✨ Main Strengths:
Adapts automatically without you tuning settings manually every time market changes.
Responds smartly to both trend quality (ER) and market energy (VR).
Reduces lag during real moves.
Filters out false signals during choppy mess.
🧪 Key Innovation compared to normal MAs:
Traditional MA Gabriel's Adaptive MA
Same smoothing every bar Dynamic smoothing every bar
Slow during fast moves Adapts fast during real moves
No understanding of volatility or trendiness Full market sensitivity
⚡ **Simple One-Line Description:**
"Gabriel's Adaptive MA is a dynamic, trend-and-volatility-sensitive moving average that intelligently adjusts its speed to match market conditions."
Multi-Day VWAP, current session only)Variation on multi day vwap, where you can choose to display 1, 2 and 3 day vwap, but only plot the current session. So each session has all 3 plots. This is especially useful for backtesting purposes. St. deviation bands included as usual.

Theonator Bank Volume Entry & Exit v2This is the best of the best of the best idnicators for sniping the big boys and aboslutely stealing cash from the other retail brokeys, just follow it on like silver or sum and it will actully blow ur mind to pieces

Stochastic and RSI2 entriesStochastic and RSI2 entries, v1.0
This indicator combines Stochastic and RSI to facilitate "RSI2" entry signals. Buy signals will be shown at the bottom.
The default configuration uses non-standard settings for the underlying indicators to tailor it for this type of entry strategy.
This is an entry strategy that tries to find entries close to "the dip".
A combination of Stochastic crossovers, VWAP, daily SMA50 and daily SMA200 are used to verify buy signals.
This indicator is written for bullish signals and aims to find the start of short trends or cheap entries for longer positions.
Like with any strategy, some signals will be false, and the user is advised to do some own research before using the buy signals for actual entries.
Happy trading!


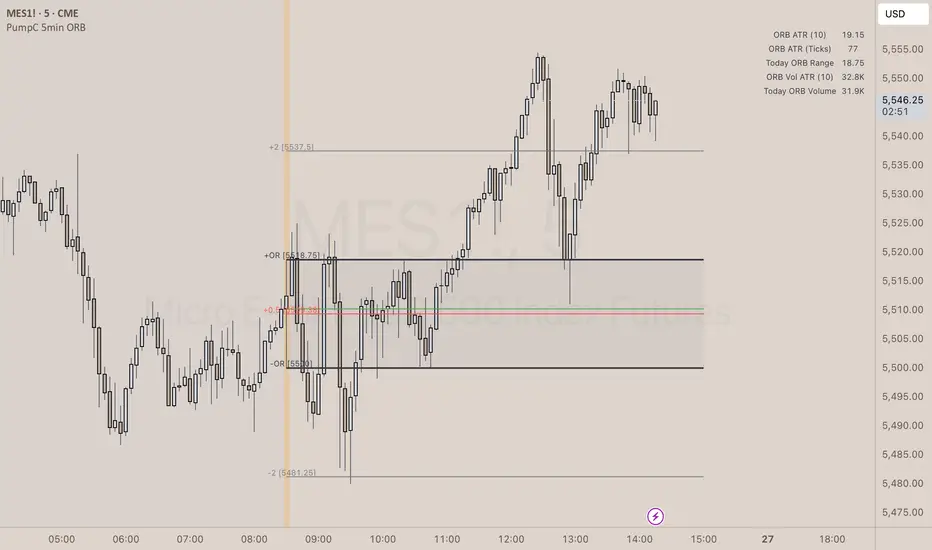
PumpC Opening Range Breakout (ORB) 5min Range📄 PumpC ORB 5-Minute Opening Range Breakout Indicator
✨ Overview
The PumpC ORB 5-Minute Opening Range Breakout indicator captures early session price action by tracking the high, low, and open of a defined 5-minute window at market open (customized for Futures or Stocks).
It plots breakout levels, extension targets, average range calculations, volume tracking, and provides visual and table-based data summaries.
This indicator is designed for traders seeking a complete, clean visualization of Opening Range Breakouts (ORB) with flexible customization.
⚙️ Main Features
Opening Range Box (ORB Box) Draws a box around the high and low of the first 5-minute session (8:30–8:35 ET for Futures, 9:30–9:35 ET for Stocks). Box extends from the session open to the session close (4:00 PM ET). Option to enable/disable historical boxes. Box color and opacity are customizable. Core ORB Levels Open Level: Plots the open price of the 5-minute ORB window. ORB Levels: Plots breakout levels at multiples: +0.5x the range +1.5x the range (customizable factor) Each level has independent color settings and visibility toggles. Option to show or hide historic extension levels. Table Display Compact table in the top-right corner showing: ORB ATR (average range) ORB ATR in ticks Today's ORB range ORB Volume ATR (average volume during ORB) Today's ORB Volume Volume is formatted automatically into "K" (thousands) or "M" (millions) for readability. Background Highlights After the ORB window closes: Blue highlight if today's ORB range is greater than the 10-day ATR average. Orange highlight if today's ORB range is smaller than the 10-day ATR average. Helps quickly assess relative strength or weakness compared to historical behavior. Alerts Breakout Confirmations: Fires when price closes above ORB High or below ORB Low. Fallout Traps: Alerts when price wick crosses ORB High/Low but closes back inside the range. Alerts use clean titles and simple messages for easy identification.
🔧 Inputs and Customization
Mode Toggle: Choose between Futures (8:30 ET open) or Stocks (9:30 ET open). Show/Hide Labels: Control label visibility for ORB and extension levels. Line Width Control: Customize thickness for ORB lines and extension levels. ORB Level Level Visibility: Independently enable or disable each extension line. Table Appearance: Customize table background color, font color, and padding. ORB Box Settings: Customize box color and control whether historical boxes are drawn.
📚 How to Use
Select Mode: Choose Futures or Stocks depending on your instrument. Observe the Opening Range: Focus on the ORB High and ORB Low during the first 5 minutes after the open. Monitor Breakouts: Breakout alerts will fire when price closes outside the ORB range, signaling potential continuation. Watch for Fallout Traps: Fallout alerts signal when price briefly wicks above/below but closes back inside the ORB range. Use Table Metrics: Instantly compare today's ORB range and volume versus historical averages to assess session strength or weakness.
🛡️ Notes
Best used on the 1-minute or 5-minute chart for intraday trading. Ensure your TradingView chart time zone is set to New York for correct functioning. Alerts must be manually configured after adding the indicator to your chart.
Whale Psychology Insights
### 🧠 Whale Psychology Insights – Unmasking Smart Money Moves
**Understand the mind games behind every candle.**
This advanced indicator is designed to reveal the psychological warfare played by whales and market manipulators in the crypto space. Stop trading blind—start trading with the insights of the smart money.
#### 🔍 What It Does:
- **Liquidity Zone Detection** – Automatically identifies key **swing highs/lows** where stop hunts are likely.
- **Volume Spike Alerts** – Spot **suspicious activity** where big players enter or exit.
- **Order Block Zones** – Highlights **bullish/bearish engulfing patterns** used by institutions.
- **Fair Value Gaps (FVG)** – Marks price inefficiencies where price may return.
- **Fakeout Detection** – Finds **manipulative wicks** designed to trap retail traders.
#### 💡 Use Cases:
- Avoid getting stopped out by **liquidity grabs**
- Enter after the **whales have made their move**
- Identify **high-probability reversal zones**
- Trade **with smart money**, not against it
Perfect for scalpers, intraday traders, and swing traders looking to understand *why* price moves—not just *where*.
> 🧠 **Trade the psychology, not just the chart.**

Dskyz Options Flow Flux (OFF) - FuturesDskyz Options Flow Flux (OFF) - Futures
*This is a repost due to moderator intervention on use of ™ in my scripts. I'm in the process of getting this rectified. This was originally posted around mid-night CDT.
🧠 The Dskyz Options Flow Flux (OFF) - Futures indicator is a game changer for futures traders looking to tap into institutional activity with limited resources. Designed for TradingView this tool simulates options flow data (call/put volume and open interest) for futures contracts like MNQ MES NQ and ES giving u actionable insights through volume spike detection volatility adjustments and stunning visuals like aurora flux bands and round number levels. Whether u’re a beginner learning the ropes or a pro hunting for an edge this indicator delivers real time market sentiment and key price levels to boost ur trading game
Key Features
⚡ Simulated Options Flow: Breaks down call/put volume and open interest using market momentum and volatility
📈 Spike Detection: Spots big moves in volume and open interest with customizable thresholds
🧠 Volatility Filter: Adapts to market conditions using ATR for smarter spike detection
✨ Aurora Flux Bands: Glows with market sentiment showing u bullish or bearish vibes at a glance
🎯 Round Number Levels: Marks key psychological levels where big players might step in
📊 Interactive Dashboard: Real time metrics like sentiment score and volatility factor right on ur chart
🚨 Alerts: Get notified of bullish or bearish spikes so u never miss a move
How It Works
🧠 This indicator is built to make complex options flow analysis simple even with the constraints of Pine Script. Here’s the step by step:
Simulated Volume Data (Dynamic Split):
Pulls daily volume for ur chosen futures contract (MNQ1! MES1! NQ1! ES1!)
Splits it into call and put volume based on momentum (ta.mom) and volatility (ATR vs its 20 period average)
Estimates open interest (OI) for calls and puts (1.15x for calls 1.1x for puts)
Formula: callRatio = 0.5 + (momentum / close) * 10 + (volatility - 1) * 0.1 capped between 0.3 and 0.7
Why It Matters: Mimics how big players might split their trades giving u a peek into institutional sentiment
Spike Detection:
Compares current volume/OI to short term (lookbackShort) and long term (lookbackLong) averages
Flags spikes when volume/OI exceeds the average by ur set threshold (spikeThreshold for regular highConfidenceThreshold for strong)
Adjusts for volatility so u’re not fooled by choppy markets
Output: optionsSignal (2 for strong bullish -2 for strong bearish 1 for bullish -1 for bearish 0 for neutral)
Why It Matters: Pinpoints where big money might be stepping in
Volatility Filter:
Uses ATR (10 periods) and its 20 period average to calculate a volatility factor (volFactor = ATR / avgAtr)
Scales spike thresholds based on market conditions (volAdjustedThreshold = spikeThreshold * max(1 volFactor * volFilter))
Why It Matters: Keeps ur signals reliable whether the market is calm or wild
Sentiment Score:
Calculates a call/put ratio (callVolume / putVolume) and adjusts for volatility
Converts it to a 0 to 100 score (higher = bullish lower = bearish)
Formula: sentimentScore = min(max((volAdjustedSentiment - 1) * 50 0) 100)
Why It Matters: Gives u a quick read on market bias
Round Number Detection:
Finds the nearest round number (e.g. 100 for MNQ1! 50 for MES1!)
Checks for volume spikes (volume > 3 period SMA * spikeThreshold) and if price is close (within ATR * atrMultiplier)
Updates the top activity level every 15 minutes when significant activity is detected
Why It Matters: Highlights psychological levels where price often reacts
Visuals and Dashboard:
Combines aurora flux bands glow effects round number lines and a dashboard to make insights pop (see Visual Elements below)
Plots triangles for call/put spikes (green/red for strong lime/orange for regular)
Sets up alerts for key market moves
Why It Matters: Makes complex data easy to read at a glance
Inputs and Customization
⚙️ Beginners can tweak these settings to match their trading style while pros can dig deeper for precision:
Futures Symbol (symbol): Pick ur contract (MNQ1! MES1! NQ1! ES1!). Default: MNQ1!
Short Lookback (lookbackShort): Days for short term averages. Smaller = more sensitive. Range: 1+. Default: 5
Long Lookback (lookbackLong): Days for long term averages. Range: 5+. Default: 10
Spike Threshold (spikeThreshold): How big a spike needs to be (e.g. 1.1 = 10% above average). Range: 1.0+. Default: 1.1
High Confidence Threshold (highConfidenceThreshold): For strong spikes (e.g. 3.0 = 3x average). Range: 2.0+. Default: 3.0
Volatility Filter (volFilter): Adjusts for market volatility (e.g. 1.2 = 20% stricter in volatile markets). Range: 1.0+. Default: 1.2
Aurora Flux Transparency (glowOpacity): Controls band transparency (0 = solid 100 = invisible). Range: 0 to 100. Default: 65
Show Show OFF Dashboard (showDashboard): Toggles the dashboard with key metrics. Default: true
Show Nearest Round Number (showRoundNumbers): Displays round number levels. Default: true
ATR Multiplier for Proximity (atrMultiplier): How close price needs to be to a round number (e.g. 1.5 = within 1.5x ATR). Range: 0.5+. Default: 1.5
Functions and Logic
🧠 Here’s the techy stuff pros will love:
Simulated Volume Data : Splits daily volume into call/put volume and OI using momentum and volatility
Volatility Filter: Scales thresholds with volFactor = atr / avgAtr for adaptive detection
Spike Detection: Flags spikes and assigns optionsSignal (2, -2, 1, -1, 0) for sentiment
Sentiment Score: Converts call/put ratio into a 0-100 score for quick bias reads
Round Number Detection: Identifies key levels and significant activity for trading zones
Dashboard Display: Updates real time metrics like sentiment score and volatility factor
Visual Elements
✨ These visuals make data come alive:
Gradient Background: Green (bullish) red (bearish) or yellow (neutral/choppy) at 95% transparency to show trend
Aurora Flux Bands: Stepped bands (linewidth 3) around a 14 period EMA ± ATR * 1.8. Colors shift with sentiment (green red lime orange gray) with glow effects at 85% transparency
Round Number Visualization: Stepped lines (linewidth 2) at key levels (solid if active dashed if not) with labels (black background white text size.normal)
Visual Signals: Triangles above/below bars for spikes (size.small for strong size.tiny for regular)
Dashboard: Bottom left table (2 columns 10 rows) with a black background (29% transparency) gray border and metrics:
⚡ Round Number Activity: “Detected” or “None”
📈 Trend: “Bullish” “Bearish” or “Neutral” (colored green/red/gray)
🧠 ATR: Current 10 period ATR
📊 ATR Avg: 20 period SMA of ATR
📉 Volume Spike: “YES” (green) or “NO” (red)
📋 Call/Put Ratio: Current ratio
✨ Flux Signal: “Strong Bullish” “Strong Bearish” “Bullish” “Bearish” or “Neutral” (colored green/red/gray)
⚙️ Volatility Factor: Current volFactor
📈 Sentiment Score: 0-100 score
Usage and Strategy Recommendations
🎯 For Beginners: Use high confidence spikes (green/red triangles) for easy entries. Check the dashboard for a quick market read (sentiment score above 60 = bullish below 40 = bearish). Watch round number levels for support/resistance
💡 For Pros: Combine flux signals with round number activity for high probability setups. Adjust lookbackShort/lookbackLong for trending vs choppy markets. Use volFactor for position sizing (higher = smaller positions)

Custom EMA + VWAP Indicator📈 Custom EMA + VWAP Indicator (v6)
This indicator displays:
8, 18, 40, and 200 EMAs (customizable colors & toggle visibility)
Session VWAP line
Optional alerts for price crossing or closing above/below each level
🔔 Use it to confirm trend, momentum, and VWAP alignment for scalping or swing trading.
💡 Ideal for traders who rely on price structure + institutional volume zones.

Order Flow Delta Trackerorderflow manager where you
Delta bars: Show net buying/selling per candle.
Cumulative Delta: Helps identify hidden buying/selling pressure.
If price rises but cumulative delta falls → possible hidden selling (divergence).
If price falls but cumulative delta rises → hidden buying.

Alpha Beta Gamma with Volume CandleAlpha Beta Gamma with Volume Candle
This Pine Script indicator analyzes price dynamics and volume activity to assist traders in identifying momentum, reversals, and key price levels. It calculates three proprietary metrics—Alpha, Beta, and Gamma—based on a user-selected price type (e.g., Open, Close, HL2) and timeframe, using a lookback period (default 37 bars). These metrics normalize price movements relative to the range of highs and lows, helping traders gauge market strength and positioning.
How It Works:
Alpha: Measures the distance of the selected price from the lowest price over the lookback period, normalized by the period length.
Beta: Represents the full price range (high minus low) over the lookback period, scaled by the period length.
Gamma: Normalizes the price’s position within the high-low range, providing a 0–1 scale for relative positioning.
Volume Analysis: The script classifies candles based on volume thresholds relative to a simple moving average (SMA, default 400 bars). High volume (≥ 2x SMA), low volume (≤ 0.5x SMA), and strong signal volume (≥ 1.5x SMA) trigger distinct candle colors to highlight bullish (e.g., deep blue, violet) or bearish (e.g., aqua, pink) conditions.
Custom Bands: Nine horizontal levels (0 to 1, divided into eight equal parts) act as dynamic support/resistance zones, useful for grid-based trading or breakout strategies.
How to Use:
Inputs:
Chart Timeframe: Select the timeframe for price data (e.g., 1H, 1D).
Price Type: Choose the price metric (e.g., Close, HL2) for calculations.
ABG Length: Adjust the lookback period (default 37) for sensitivity.
Volume MA Length: Set the SMA period for volume analysis (default 400).
Volume Thresholds: Customize high, low, and strong volume multipliers.
Visual Settings: Toggle labels, custom bands, and table display; adjust line styles, label sizes, and table positions.
Interpretation:
Use Alpha, Beta, and Gamma plots to assess price momentum and range dynamics.
Monitor colored candles for volume-driven signals (e.g., violet for strong bullish volume).
Leverage custom bands for support/resistance or breakout trading.
Check the table for real-time ABG values and percentage changes.
Settings Tips:
For scalping, reduce the ABG Length (e.g., 20) and use a shorter timeframe (e.g., 5M).
For swing trading, increase the Volume MA Length (e.g., 600) for more stable volume signals.
Enable labels and custom bands for visual clarity on key levels.
This indicator is versatile for various trading styles, combining price-based metrics with volume analysis to enhance decision-making.

Smart Market Matrix Smart Market Matrix
This indicator is designed for intraday, scalping, providing automated detection of price pivots, liquidity traps, and breakout confirmations, along with a context dashboard featuring volatility, trend, and volume.
## Summary Description
### Menu Settings & Their Roles
- **Swing Pivot Strength**: Controls the sensitivity for detecting High/Low pivots.
- **Show Pivot Points**: Toggles the display of HH/LL markers on the chart.
- **VWMA Length for Trap Volume** & **Volume Spike Multiplier**: Identify concentrated volume spikes for liquidity traps.
- **Wick Ratio Threshold** & **Max Body Size Ratio**: Detect candles with disproportionate wicks and small bodies (doji-ish) for traps.
- **ATR Length for Trap**: Measures volatility specific to trap detection.
- **VWMA Length for Breakout Volume**, **ATR Multiplier for Breakout**, **ATR Length for Breakout**, **Min Body/Range Ratio**: Set adaptive breakout thresholds based on volatility and volume.
- **OBV Smooth Length**: Smooths OBV momentum for breakout confirmation.
- **Enable VWAP Filter for Confirmations**: Optionally validate breakouts against the VWAP.
- **Enable Higher-TF Trend Filter** & **Trend Filter Timeframe**: Align breakout signals with the 1h/4h/Daily trend.
- **ADX Length**, **EMA Fast/Slow Length for Context**: Parameters for the context dashboard (Volatility, Trend, Volume).
- **Show Intraday VWAP Line**, **VWAP Line Color/Width**: Display the intraday VWAP line with custom style.
### Signal Interpretation Map
| Signal | Description | Recommended Action |
|--------------------------------|-----------------------------------------------------------|-------------------------------------------|
| 📌 **HH / LL (pivot)** | Market structure (support/resistance) | Note key levels |
| **Bull Trap(green diamond)** | Sweep down + volume spike + wick + rejection | Go long with trend filter
| **Bear Trap(red diamond)** | Sweep up + volume spike + wick + rejection | Go short with trend filter
| 🔵⬆️ **Breakout Confirmed Up** | Close > ATR‑scaled high + volume + OBV↑ | Go long with trend filter |
| 🔵⬇️ **Breakout Confirmed Down** | Close < ATR‑scaled low + volume + OBV↓ | Go short with trend filter |
| 📊 **VWAP Line** | Intraday reference to guide price | Use as dynamic support/resistance |
| ⚡ **Volatility** | ATR ratio High/Med/Low | Adjust position size |
| 📈 **Trend Context** | ADX+EMA Strong/Moderate/Weak | Confirm trend direction |
| 🔍 **Volume Context** | Breakout / Rising / Falling / Calm | Check volume momentum |
*This summary gives you a quick overview of the key settings and how to interpret signals for efficient intraday scalping.*
### Suggested Settings
- **Intraday Scalping (5m–15m)**
- `Swing Pivot Strength = 5`
- `VWMA Length for Trap Volume = 10`, `Volume Spike Multiplier = 1.6`
- `ATR Length for Trap = 7`
- `VWMA Length for Breakout Volume = 12`, `ATR Length for Breakout = 9`, `ATR Multiplier for Breakout = 0.5`
- `Min Body/Range Ratio for Breakout = 0.5`, `OBV Smooth Length = 7`
- `Enable Higher-TF Trend Filter = true` (TF = 60)
- `Show Intraday VWAP Line = true` (Color = orange, Width = 2)
- **Swing Trading (4h–Daily)**
- `Swing Pivot Strength = 10`
- `VWMA Length for Trap Volume = 20`, `Volume Spike Multiplier = 2.0`
- `ATR Length for Trap = 14`
- `VWMA Length for Breakout Volume = 30`, `ATR Length for Breakout = 14`, `ATR Multiplier for Breakout = 0.8`
- `Min Body/Range Ratio for Breakout = 0.7`, `OBV Smooth Length = 14`
- `Enable Higher-TF Trend Filter = true` (TF = D)
- `Show Intraday VWAP Line = false`
*Adjust these values based on the symbol and market volatility for optimal performance.*

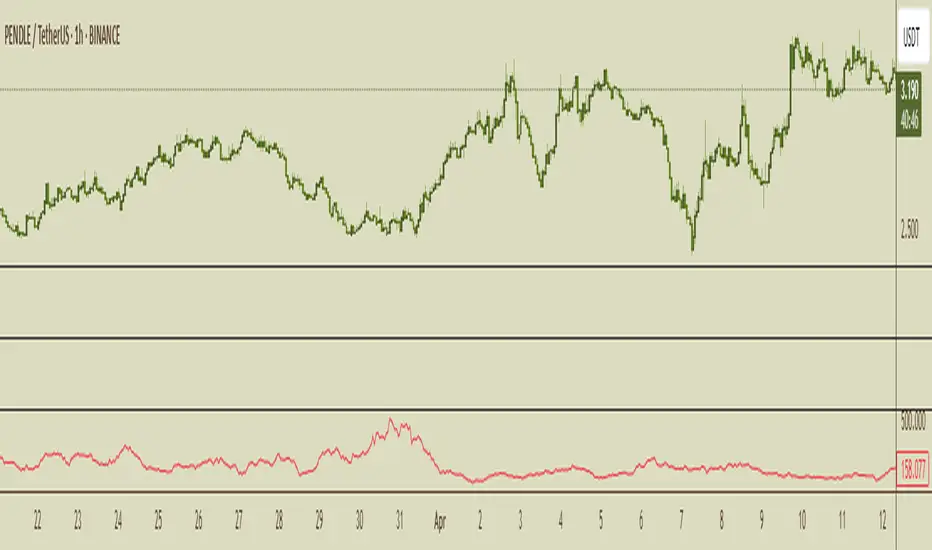
Volume USDTName:
USDT Volume Bars (Directional Colors)
Description:
This indicator visualizes trading volume in USDT by multiplying the candle's volume by the average of its open and close prices. The result reflects a more realistic estimation of the traded value per candle.
🟩 Green bars: Bullish or neutral candles (close ≥ open)
🟥 Red bars: Bearish candles (close < open)
Useful for spotting high-value inflows and outflows based on actual price-weighted volume.

Jinsu RSI 14### 🔍 **Jinsu RSI 14 – EMA 9 & WMA 45**
**Description:**
This custom indicator combines the classic RSI (Relative Strength Index) with two moving averages — EMA (Exponential Moving Average) and WMA (Weighted Moving Average) — applied directly to the RSI value to provide more nuanced momentum signals.
### 📊 **How It Works**
- **RSI 14** measures market momentum and identifies overbought (above 70) or oversold (below 30) conditions.
- **EMA 9 on RSI** responds quickly to short-term changes, signaling momentum shifts.
- **WMA 45 on RSI** captures long-term sentiment, while placing more emphasis on recent data.
### 🧠 **Signal Interpretation**
- **RSI crosses above EMA 9** → Possible bullish momentum shift.
- **RSI falls below EMA 9** → Possible bearish momentum shift.
- **EMA 9 crosses above WMA 45** → Strong bullish momentum.
- **EMA 9 falls below WMA 45** → Strong bearish momentum.
- **RSI is between EMA 9 & WMA 45** → Market may be consolidating or oscillating.
### 🎨 **Visual Enhancement**
- The neutral zone (RSI between 30–70) is lightly shaded purple to reduce visual noise.
- When **RSI > 70**, a green color appears and intensifies with higher RSI values, highlighting strong buying pressure.
- All values are displayed with two decimal precision for clarity.
This tool is ideal for trend-following traders and momentum-based strategies, helping you recognize early shifts in market sentiment with visual cues and cross confirmations.

Price Map Profile [BigBeluga]An advanced volume-based tool designed to map out how trading activity is distributed across price levels. It combines dynamic volume profiling with structural pivot detection to highlight key levels of interest in the market — including hidden support/resistance zones and dominant liquidity areas.
Unlike traditional volume profiles locked to fixed sessions, this indicator continuously processes historical bars to build a real-time "map" of volume distribution. It intelligently reveals where buyers and sellers were most active, helping traders pinpoint high-impact zones with clarity.
🔵 KEY FEATURES
Creates a volume map profile by scanning price action over a defined lookback window (`length`).
Divides price vertically into volume bins (default: 100) and aggregates either total volume or bar count per bin.
Bins are plotted as horizontal zones extending to the right of the chart — wider offset means more volume at that price.
Each zone is color-coded using gradients to represent volume magnitude:
- Below average volume = cool tones (blue/teal)
- Above average volume = warm tones (red/orange)
The highest volume bin is highlighted with a red label showing the exact volume, helping to identify strong price agreement.
Detects pivot highs and lows using a 15-bar swing method, marking them as potential S/R levels.
If a pivot level is located inside a low-volume zone (volume < average), it is emphasized with a dashed line and label .
Pivot line color matches direction:
- High pivots = yellow
- Low pivots = aqua
The volume of the bin containing the pivot is shown alongside the pivot, providing volume context for the structural level.
Filters out nearby duplicate pivots using ATR-based distance checks to ensure clean and non-redundant signals.
🔵 HOW TO USE
Use the wide red zones as liquidity and consolidation areas where price may stall, reverse, or absorb volume.
Pivot-based dashed lines within low-volume zones highlight hidden support/resistance levels where price may react sharply.
Combine this indicator with trend or order flow tools to validate reversal or breakout setups .
Switch between Volume and Frequency modes to adapt to the type of data your asset provides.
🔵 CONCLUSION
The Price Map Profile transforms raw volume into an actionable visual map. By aligning volume depth with key market structure levels, it helps traders identify where market participants are most active — and where hidden inefficiencies lie. Ideal for traders seeking precision entries, dynamic S/R zones, and deeper volume structure insight.

Amihud Liquidity RatioCalculates liquidity as a sort of moving average over time
The Amihud Illiquidity Ratio (ILLIQ) measures the price impact of trading volume. It's calculated as the absolute daily return divided by the daily dollar volume:
𝐼𝐿𝐿𝐼𝑄ₜ = |𝑅ₜ| / 𝑉𝑂𝐿𝐷ₜ
Where:
|𝑅ₜ| is the absolute value on return day t
𝑉𝑂𝐿𝐷ₜ is the dollar trading volume on day t
Here's how you can incorporate this indicator into your analysis:
1. Identifying Liquidity Regimes:
High Liquidity (Low Indicator Values): When the indicator is consistently low, it suggests a market or asset where it's generally easier to enter and exit positions without significant slippage. This might be a more favorable environment for strategies that rely on tight spreads and efficient order execution.
Low Liquidity (High Indicator Values): When the indicator is consistently high or spiking, it signals periods of lower liquidity. This can lead to:
Increased Volatility: Fewer participants and larger bid-ask spreads can amplify price movements.
Higher Slippage: Executing large orders might result in getting a worse price than expected.
Gap Risk: Significant price gaps can occur between trading sessions due to a lack of continuous trading interest.
---------------------------------------------------------------------------------------------------------------------
2. Confirming Trends and Breakouts:
Trend Confirmation:
Uptrend with Increasing Liquidity (Falling Amihud): A healthy uptrend often sees increasing participation and ease of trading. A falling Amihud during an uptrend can provide confidence in the trend's sustainability.
Uptrend with Decreasing Liquidity (Rising Amihud): An uptrend accompanied by rising Amihud might be less stable. It could suggest that the price increase is driven by fewer participants and might be more prone to reversals.
The same logic applies to downtrends, but in reverse.
---------------------------------------------------------------------------------------------------------------------
Breakout Confirmation:
Breakout with Increasing Liquidity (Falling Amihud): A breakout accompanied by increasing liquidity (falling Amihud) can suggest strong conviction and a higher probability of the breakout being sustained.
Breakout with Decreasing Liquidity (Rising Amihud): A breakout on low liquidity might be more suspect and could be a "fakeout" if there isn't enough sustained buying or selling pressure.
---------------------------------------------------------------------------------------------------------------------
3. Identifying Potential Reversal Points:
Liquidity Exhaustion: Sometimes, a prolonged period of low liquidity (high Amihud) might precede a reversal. The lack of active trading interest at those levels could make the price more susceptible to a shift in sentiment.
Liquidity Surges: A sudden spike in liquidity (a sharp drop in Amihud) after a period of low liquidity could indicate renewed interest and potentially the start of a new trend or a reversal of the previous one.
-----------------------------------------------THANK YOU----------------------------------------------------------------------------------------------------------------------------------------------------------------------------------------------------------------------------------<3-----------------------------------------------