1000RATS/USDT: 100%+ PROFIT POTENTIAL SETUP!!🚀 1000RATS Breakout Alert – 100%+ Potential Incoming?! 👀🔥
Hey Traders! If you're all about high-conviction plays and real alpha, smash that 👍 and tap Follow for more setups that actually deliver! 💹💯
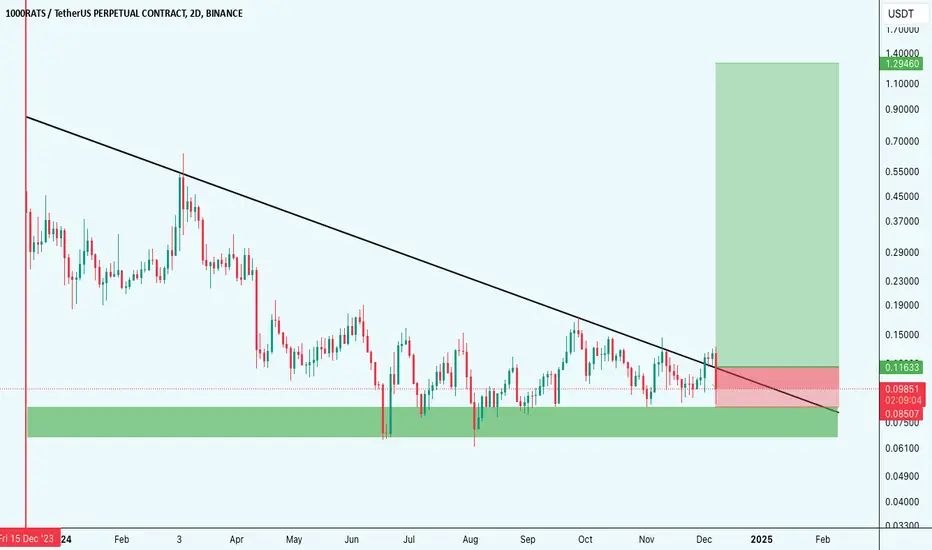
1000RATS has officially broken out of a beautifully formed Cup and Handle pattern — a strong bullis

Profitable Short Opportunity on RATS (6H)The RATS token is bearish in both the larger and internal structures. There is a liquidity pool below the current price, and it's expected to collect sell orders from a strong supply zone before sweeping this liquidity pool.
If the price reaches the red box, we will enter a short position.
Targets

1000RATSUSDT preparing for a big dropVolume suggest that this cryptocurrency does not have what it takes in the short term to maintain the bullish move it made recently. I think that the 0.025 resistance will hold and we will see a rejection to continue to the downside.
TP1 : 0.0207
FINAL TP :0.0150

#1000RATSUSDT maintains bearish momentum📉 SHORT BYBIT:1000RATSUSDT.P from $0.01823
🛡 Stop Loss: $0.01855
⏱ 15M Timeframe
✅ Overview:
➡️ BYBIT:1000RATSUSDT.P is in a downtrend after rejecting the descending trendline, confirming buyer weakness.
➡️ Volume Profile suggests that the main liquidity (POC) is positioned at $0.01938, r

$1000RATS Holds Key Trendline Support: Bounce Incoming? $1000RATS is testing a key trendline breakout and holding strong near support. A possible bounce could be on the way! 🚀
Keep a close watch. DYOY, NFA.$1000RATS Holds Key Trendline Support: Bounce Incoming?

1000RATS Trade Setup1000RATS is ready to rally 20% to 30% more from the current price. A strong rebound has already occurred, with the price likely to reach $0.16 to $0.18.
~ Entry: CMP.
~ Accumulation: $0.12.
~ Leverage: 3x.
~ Targets: $0.16 and $0.18.
Note: Always do your own research and analysis before investing.

1000RATSUSDT: Breakout Watch – Will Bulls Take Charge ?!?!?!?!?!This chart shows a potentially bullish setup but with important caveats to consider:
- The **Parabolic SAR (PSR)** has flipped green, signaling bullish momentum.
- The price is trading above the **200-day MA**, a strong indicator of a potential trend reversal. However, this signal will be more si

Bullish on $1000RATS (Binance Futures)1. We have the setup pyramided in a weekly orderblock
2. We have the market inside the daily orderblock
3. We have a market structure shift (MSS) in H4
4. We have a first delivery which delivers price first to an easy draw (roadblock first if any)
5. We have a second delivery which created a higher

BULLISH POTENTIAl - 1000RATSUSDTSupport and Fibonacci Confluence:
The price is consolidating near the 0.382 Fib level (0.10471), which often acts as a significant retracement support in a bullish continuation setup. This zone can provide a strong launchpad for further upside.
Upside Potential:
First target (TP1): The Fib 1.0 lev

See all ideas
Summarizing what the indicators are suggesting.
Oscillators
Neutral
SellBuy
Strong sellStrong buy
Strong sellSellNeutralBuyStrong buy
Oscillators
Neutral
SellBuy
Strong sellStrong buy
Strong sellSellNeutralBuyStrong buy
Summary
Neutral
SellBuy
Strong sellStrong buy
Strong sellSellNeutralBuyStrong buy
Summary
Neutral
SellBuy
Strong sellStrong buy
Strong sellSellNeutralBuyStrong buy
Summary
Neutral
SellBuy
Strong sellStrong buy
Strong sellSellNeutralBuyStrong buy
Moving Averages
Neutral
SellBuy
Strong sellStrong buy
Strong sellSellNeutralBuyStrong buy
Moving Averages
Neutral
SellBuy
Strong sellStrong buy
Strong sellSellNeutralBuyStrong buy
Displays a symbol's price movements over previous years to identify recurring trends.