SATS Buy/Long Setup (1H)Given the bullish structure, the formation of bullish BOS (Break of Structure), the preservation of the trendline, and the absence of any significant supply zone in front of the candles, we can consider entering this setup with proper risk and capital management.
The targets are marked on the chart

1000SAT Trade Setup – Neckline Retest📊 1000SAT Trade Setup – Neckline Retest 📈
🔹 Current Action: Pulling back to Green Neckline (Inverted H&S) 🟢
✅ Confirmation: Break & Close Above Red Resistance Zone 🔴
🎯 Target: Green Line Level 🚀
⚠️ Invalidation: Breakdown Below Green Neckline 👇

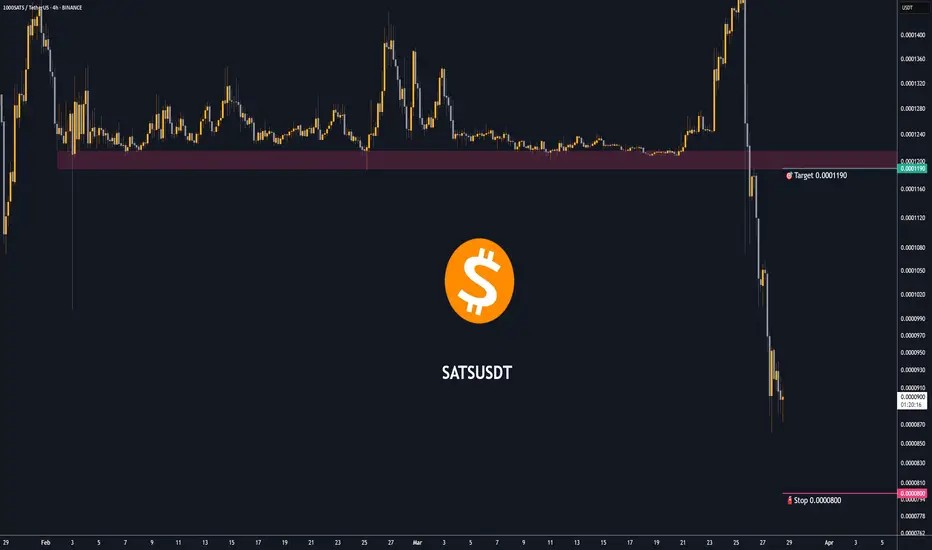
Trading opportunity for 1000SATSUSDTBased on technical factors there is a Buy position in :
📊 1000SATSUSDT
🔵 Buy Now
🪫Stop loss 0.0000800
🔋Target 0.0001190
📏 R/R 3
💸RISK : 1%
We hope it is profitable for you ❤️
Please support our activity with your likes👍 and comments📝
Trading opportunity for 1000SATSUSDT SATS (Ordinals)Based on technical factors there is a Buy position in :
📊 1000SATSUSDT
🔵 Buy Now
🪫Stop loss 0.0000950
🔋Target 0.0001850
📏 R/R 2,2
💸RISK : 1%
We hope it is profitable for you ❤️
Please support our activity with your likes👍 and comments📝

1000SATS/USDT (Binance - 1D Chart)📍 Timeframe: 1D (Binance Exchange)
📈 Current Price: 0.0001268 (+1.93%)
Key Technical Insights:
Accumulation & Breakout Setup:
Price has been consolidating at a low volatility range for several weeks.
Potential breakout setup is forming, as indicated by the bullish structure.
Support & Resistance L

1000SATS1000SATS / USDT
1D time frame
analysis tools
____________
SMC
FVG
Trend lines
Fibonacci
Support & resistance
MACD Cross
EMA Cross
______________________________________________________________
Golden Advices.
********************
* Please calculate your losses before any entry.
* Do not enter any

1000SATS/USDTKey Level Zone: 0.0001235 - 0.0001250
HMT v4.1 detected. The setup looks promising, supported by a previous upward/downward trend with increasing volume and momentum, presenting an excellent reward-to-risk opportunity.
HMT (High Momentum Trending):
HMT is based on trend, momentum, volume, and mark

1000SATS/USDTKey Level Zone: 0.0001205 - 0.0001215
HMT v4.1 detected. The setup looks promising, supported by a previous upward/downward trend with increasing volume and momentum, presenting an excellent reward-to-risk opportunity.
HMT (High Momentum Trending):
HMT is based on trend, momentum, volume, and mark

Optimized MACD Study with AlertsThis Pine Script study enhances the classic MACD indicator with additional functionality, making it a powerful tool for traders who want actionable and visually intuitive signals on their charts. It is designed to help traders identify BUY and SELL opportunities with customizable alerts, along with

1000Sats / USDT : Poised for a breakout from middle support 1000SATS/USDT: Poised for a Breakout from Middle Support
1000SATS/USDT is showing promising signs 📈 as it holds firmly at a key middle support zone 📊. The pair is building momentum, creating an ideal setup for a potential breakout 💥. If confirmed, this move could trigger a strong bullish rally 🚀. S

See all ideas
Summarizing what the indicators are suggesting.
Oscillators
Neutral
SellBuy
Strong sellStrong buy
Strong sellSellNeutralBuyStrong buy
Oscillators
Neutral
SellBuy
Strong sellStrong buy
Strong sellSellNeutralBuyStrong buy
Summary
Neutral
SellBuy
Strong sellStrong buy
Strong sellSellNeutralBuyStrong buy
Summary
Neutral
SellBuy
Strong sellStrong buy
Strong sellSellNeutralBuyStrong buy
Summary
Neutral
SellBuy
Strong sellStrong buy
Strong sellSellNeutralBuyStrong buy
Moving Averages
Neutral
SellBuy
Strong sellStrong buy
Strong sellSellNeutralBuyStrong buy
Moving Averages
Neutral
SellBuy
Strong sellStrong buy
Strong sellSellNeutralBuyStrong buy
Displays a symbol's price movements over previous years to identify recurring trends.