AAVE — Breakout! $200 in the making?AAVE has been on my radar for weeks, and it’s not hard to see why:
• Strong Performance: Outperformed many altcoins over the past few months.
• Solid Business Model: AAVE’s fundamentals remain robust.
• Rapid Recovery: Bounced back quickly after the recent crash, now up over 70% from its bottom.
But here’s the big news: AAVE just broke through the crucial $120 resistance.
Aside from a brief attempt in March, AAVE hasn’t traded above this level since May 2022. (!!!)
What’s Next?
In my view, AAVE could be one of the strongest players in Q3 and Q4. If it can confirm this breakout and push past $145, we might see AAVE heading towards $200+.
Of course, as always, this depends on Bitcoin’s performance.
AAVEUSDT.PS trade ideas


AAVE Surges by 5% - Is This the Start of a Bullish Trend?
AAVE, one of the leading DeFi protocols, has seen its price surge by 5% today, signaling a potential bullish trend. This price movement is not just a random spike; it coincides with a significant increase in weekly borrowers on the AAVE platform, hitting a new all-time high (ATH). In this analysis, we'll dive into AAVE's price action, on-chain activity, and what this could mean for the future of the token. For more details, check out the full article on crypto.ro.
Price Analysis
Looking at the daily chart, AAVE has broken through a key resistance level, which previously acted as a strong barrier. This breakout is accompanied by higher-than-average trading volume, suggesting strong buying interest. The next resistance level to watch is around , while the support is likely to be found at .
The recent 5% increase aligns with a bullish trend that has been forming over the past week. If AAVE can sustain its momentum and close above the moving average, we could see a continuation of this uptrend.
Borrowers and On-Chain Activity
A notable factor behind this price movement is the surge in weekly borrowers on the AAVE platform, reaching a new ATH. This increased borrowing activity often indicates higher demand for the token, as borrowers are leveraging AAVE for its lending and borrowing services. The correlation between on-chain activity and price action is strong, and this uptick could be a leading indicator of further price appreciation. For more in-depth insights, visit the AAVE page on crypto.ro.
Comparative Analysis
When compared to other DeFi tokens, AAVE appears to be outperforming its peers. While many DeFi tokens are experiencing sideways movement or slight gains, AAVE's 5% surge stands out. This outperformance could attract more investors looking for the next big move in the DeFi space.
Indicators to Watch
RSI (Relative Strength Index): Currently trending upwards but not yet in overbought territory, indicating room for further growth.
MACD (Moving Average Convergence Divergence): The MACD line is crossing above the signal line, which is a classic bullish signal.
Moving Averages: Watch the 50-day and 200-day moving averages for potential support or resistance zones.
These indicators can help identify potential entry points if you're looking to capitalize on this momentum.
AAVE's recent price action, coupled with the surge in on-chain activity, suggests that we might be at the beginning of a bullish trend. However, as with any market, it's crucial to keep an eye on key support and resistance levels, as well as relevant technical indicators. Do you believe AAVE will continue its upward trajectory, or is a correction on the horizon? Let us know your thoughts in the comments!

AAVE looks bearish (4H)After the recent pump, AAVE has reached the premium range of the previous wave and hit a supply.
We have a bearish CH on the chart, which is preferable to a bullish iCH.
AAVE can drop to the specified targets on the chart.
Closing a daily candle above the invalidation level will violate the analysis
Note that the financial market is risky, so:
Do not enter a position without setting a stop and capital management and confirmation and trigger.
When we reach the first TP, save some profit and try to move the stop continuously in the direction of your profit.
If you have any comments please post them, comments will help us improve our performance
Thanks

AAVE should be the top gainer soonAAVE is showing strong potential. I'm looking to buy within the $105-$112 range. Once it breaks above $120, it will become the top gainer. I'm expecting a 2x return. This will be a mid-term hold with no stop loss set at the moment.

AAVE will fly like a rocketWe see a long-term accumulation of more than two years
Zone 100-110 is a serious resistance line, a lot of accumulated energy in the range
We see numerous approaches to the level and pressure to the resistance level
There is a high probability that we will soon have resistance breakout and access to the next resistance around 250
I am considering buying from current levels and take profit around 240, I use spot and do not use leverage. Stay safe!

Aave Looking Strong Here Aave Looking Strong And Consolidating With Bullish Pennant While Other Coins Are Crashing Aave Preparing For Solid Breakout Incase Of Successful breakout expecting Move Towards 200$

AAVE SHORT IDEA 14/08/24AAVE SHORT IDEA
- Golden Pocket
- 2 Weeks POC
- RSI overbought and div and 30m

AAVEUSDT Updated till 14-08-24AAVEUSDT Daily timeframe range. stuck between 77.86-109.60 for a long time now. but staying above 77.86 will eventually push it toward above 109.60. but when! it depends on alt market cash flow. or devs comes up with something.

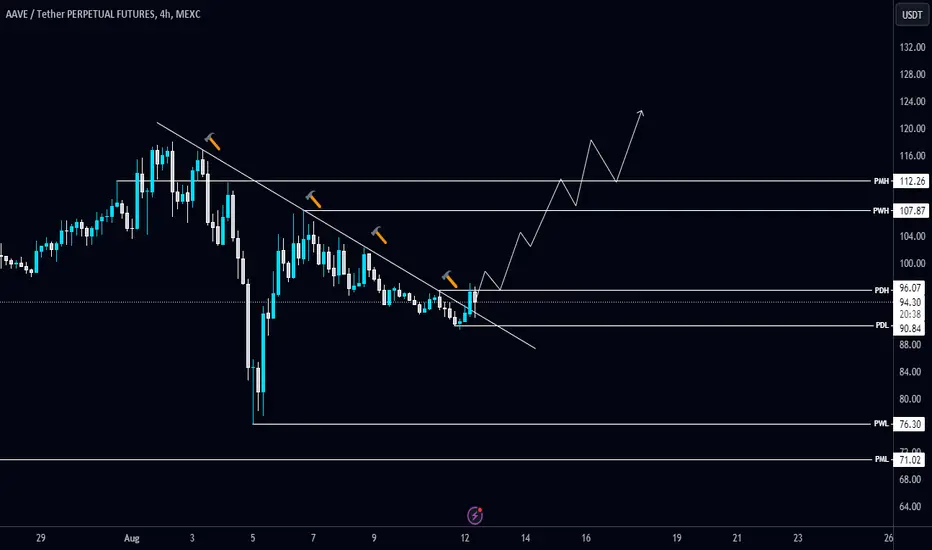
#AAVE/USDT breaks the Diagonal Trendline and retests it in 4H#AAVE/USDT breaks the Diagonal Trendline and retests it in 4-Hour TF!
We can expect a bounce from here if EURONEXT:AAVE is held above it. The local resistance level is PWH $107.87 and the support level is PWL $76.3.
AAVE next trade ideaAAVE/USDT is very good coin for scalping and day trading. Now i have found a swing setupin it. As mentioned on the chart liquidity swept and did MSS. FVG is very good area to take long. Keep eye on it.


AAVE 170$ targetWhy we can see 170$ for BINANCE:AAVEUSDT ?
Possible Targets and explanation idea
➡️Weekly tf, red zone is Order Flow and stop losses will be like a fuel for uptrend move
➡️50% of weekly gap would be final stage for downtrend
➡️We trade almost 500 days around 27 zone (accumulation zone)
➡️On Direction indicator need to see accumulation from whales again
➡️Small triangles up is from TradeON indicator recommendation close short on W
➡️136$ will be full fill M gap and only 0 level will be 170. Big moves is coming
Hope you enjoyed the content I created, You can support with your likes and comments this idea so more people can watch!
✅Disclaimer: Please be aware of the risks involved in trading. This idea was made for educational purposes only not for financial Investment Purposes.
---
• Look at my ideas about interesting altcoins in the related section down below ↓
• For more ideas please hit "Like" and "Follow"!

AAVE best time for accumulation in 2023
Possible Targets and explanation idea
➡️Weekly chart. BearMarket over 2 years. Since April 2021.
➡️Fib came in -0.27 zone. Accumulation zone
➡️Trade under fundamental price (real value) of this coin (yellow last line)
➡️First main target for AAVE - 193$ take profit line. Over 0 level by FIB
➡️Bellow Market Mood indicator represent the best time for accumulation. White colour zones. Even if you use DCA strategy.
➡️Look on a chart and you can count in average price if you buying in white mood zones.
Hope you enjoyed the content I created, You can support with your likes and comments this idea so more people can watch!
✅Disclaimer: Please be aware of the risks involved in trading. This idea was made for educational purposes only not for financial Investment Purposes.
---
• Look at my ideas about interesting altcoins in the related section down below ↓
• For more ideas please hit "Like" and "Follow"!

AAVE going to doubleInsanely long accumulation range with money flow headed north. Moving averages are now aligned. Once it breaks out, should see blue skies until 240

AAVE going to doubleInsanely long accumulation range with money flow headed north. Moving averages are now aligned. Once it breaks out, should see blue skies until 240

papicoin long term strategy for aave $aaveblessings to all sisters and brothers who search and work for consciousness, love and freedom.
for you who understand what is going on and see on crypto the opportunity to empower decentralized communities for decentralized power and wealth, i am glad to share my long term strategy on theses cryptos that I am willing to accumulate and hodl.
the green areas are the ones I will use to but and accumulate, the lower the prices the more amount of capital, of course.
in the blue areas I will be taking some profits, the higher the price the more I will distribute.
feel free to ask anything, i would be glad to answer, but I do not promise immediate responses, lol.
keep connecting to the vibrations and elevating the frecuencies for the human awakening by meditating, praying, celebrating and being the origin of love and harmony!

AAVEUSDT.PAAVEUSDT.P is in bullish trend.
Printing HH and HL.
Bullish divergence also form in RSI.
No sign of reversal here we wait and watch for the breakout of last HH.

Spot buy AAVEI'm starting to accumulate spot AAVE
820 days of accumulation. See yall at $150+ in a few months

AAVE Looking Strong — Long Entry at $120AAVE is one of the rare altcoins that showed strength throughout the year. Compared to its March high, AAVE is down only 19% and has been trading in a sideways range since April.
Moreover, after the recent crash, AAVE recovered completely and is back above the EMA200 and the pre-drop level.
Although I am still "on hold" regarding new long trades due to the overall market situation and the Middle East tensions, AAVE is at the top of my trading list.
$120 seems to be a reasonable entry point to ride the wave to the previous top and, depending on the market, even higher.
Keep a close eye on AAVE!

AAVEOn the above 4-day chart price action has corrected 90%. Today is great long opportunity. Why?
1) RSI and price action resistance breakouts.
2) Multiple oscillators print bullish divergence with price action with confirmation.
3) Price action prints support on past resistance since breakout. Look left.
Is it possible price action falls further? Sure.
Is it probable? No.
Ww
Type: trade
Risk: <=6% of portfolio
Timeframe: Now, don’t sit on your hands.
Return: 110 dollars for starters and soonish

AAVE Scalp ShortAAVE going on downtrend, VRVP volume ir POC showing bearish trend,
price now moving slow on 0.618, posible soon will looking for short scalp,
matters how Btc moves up or down

AAVEUSDTmy entry on this trade idea is taken from a point of interest BELOW an inducement.. I extended my stoploss area to cover for the whole swing as price can target the liquidity there before going as i anticipate.. just a trade idea, not financial advise
