AAVEUSDT|The end of the BULLISH trendAfter the upward lag that started at the price of 63 dollars, it has continued its upward trend in the form of an ASCENDING channel.
By reaching the resistance levels, we saw returns from these areas as long shadows, which indicates high liquidity in these areas and it is difficult to pass through these areas.
Multiple reversals from these areas show the weakness of the momentum, if the last downward movement leads to the breaking of the channel, we can enter sales transactions in the reversals to the channel, up to the support levels created by the origin of the movement.
The prices of 78.26 and 63.51 are suitable targets for selling transactions.
AAVEUSDT trade ideas


AAVEUSDT 100% UpsideAAVEUSDT has established a significantly vast demand zone adjacent to the $50 psychological level, consistently respected over four consecutive instances, emphasizing substantial buying pressure within this zone. Preceding the recent bounce, AAVE broke above a downtrend trendline, signaling readiness for further upside potential. Subsequent to a robust correction and the last retest of the $50 support, a formation of higher highs and higher lows has become evident, indicating a bullish reversal.
The $80 supply zone has transformed into a demand area, witnessing a bounce off the average-price uptrend trendline. Presently, AAVEUSDT appears poised to initiate a significant rally. Overall, our projections anticipate a 100% price surge from the most recent demand area. This surge is aimed towards the 361.8% Fibonacci retracement level, aligning with the top of the extended ascending channel.

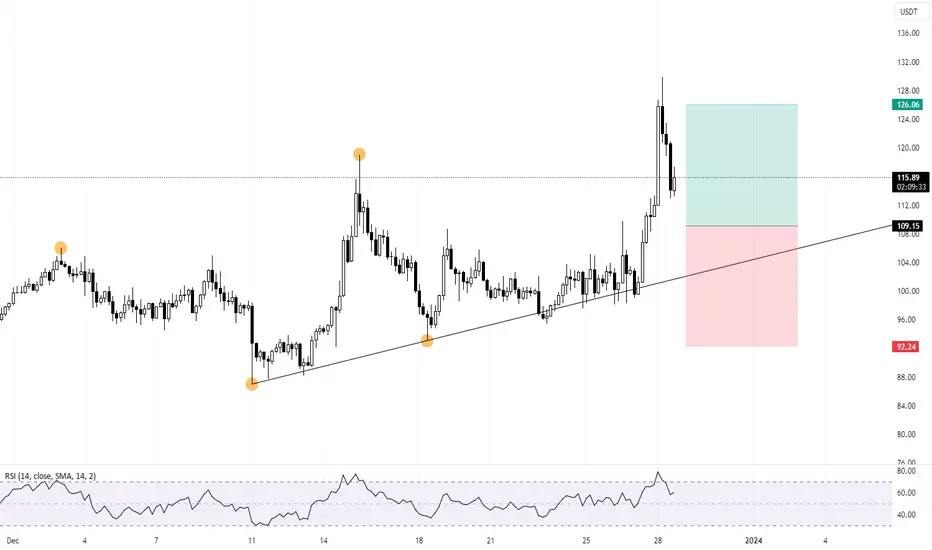
AAVE: Pullback in UptrendTrade setup : Price is in an Uptrend. It briefly broke above $115 and $125 resistance, making a Higher High (sign of Uptrend) but got overbought (RSI > 70) and pulled back. Now we wait for price to either 1) break above $115 to signal continuation of uptrend, with upside to $125 near-term, or 2) pull back near $95-100 support zone for a swing entry in Uptrend with upside potential back to $115 near-term and $125 medium-term.
Trend : Uptrend across all time horizons (Short- Medium- and Long-Term).
Momentum is Mixed as MACD Line is below MACD Signal Line (Bearish) but RSI ~ 50 (Neutral).
Support and Resistance : Nearest Support Zone is $95, then $80. The nearest Resistance Zone is $115, then $125.

✴️ Aave FaltersGood night my fellow Cryptocurrency trader, let's look at Aave shall we?
While AAVEUSDT continues trading within an ascending channel, we have something not seen before in the past few months.
Yesterday's session pushed prices below EMA21/10 and ended with a long lower wick, this is accompanied by a rise in sell volume as well as the RSI going bearish.
You can see the bull-trap and rounded top; A strong spike upwards just to be negated the following day. Later on prices move below 0.236 Fib. and all the signals that I just mentioned, leads to the red arrow.
Remember, it will start slow and quiet and will end up loud and strong.
Namaste.

AAVE OpportunityAAVE big accumulation going on, retest in progress.
Waiting for the price to go up to the W/M orderblock around 200-250usd

AAVEUSDT.P Aggressive Trend TradeAggressive Trend trade 1R
- long impulse
+ resistance level
+ biggest untested volume T1
+ biggest untested volume 2Ut-
+ weak test
Calculated affordable stop loss
1 to 2 R/R take profit
1D context
+ short impulse
+ SOW test / T2 level
+ resistance level
+ 1/2 correction
+ first bar didn't close above
10% of the of trading account to mitigate risk.

Best Trade 2024In my opinion, the overall future of this currency pair is bullish and I am waiting for an entry based on the areas I have identified

I Cannot Short This !!! situation+next targets.AAVEUSDT is in an ascending triangle which means the price is about to do a good bullish movement. The price can increase as much as the measured price movement ( AB=CD ) .The break out needed for increasing further has not happened but it should happen pretty soon.
🤑Stay awesome my friends.
_ _ _ _ _ _ _ _ _ _ _ _ _ _ _ _ _ _ _ _ _ _ _ _ _ _ _ _ _ _ _ _ _
✅Thank you, and for more ideas, hit ❤️Like❤️ and 🌟Follow🌟!

AAVEAnother bullish gartley harmonic setup..
Looks pretty good
Fits with macro aave structure which has been begging to breakout for a while..

Candle of breaked(AAVE)❤️❤️Thanks for boosting 🚀 and supporting us!
📈When I am in a reng and that reng is broken with a powerful candle, I can decide to follow the same process from the broken side, and AAVE has exactly the same conditions.
📊 (Entry) : 119.57
🔴 Stop Loss : 111.34
🎯 Take Profit : 125-131-138-144
🔗 For more communication with us, In the footnote and send a message in TradingView.
👨🎓 Experience and Education: Our trading team has five years of experience in financial markets, especially cryptocurrencies.

AAVE spot holdWhen AAVE breaks through the resistance, expect big things.
Even though there is resistance, I believe we'll surpass it and go higher. At most, we might dip a little, where we can buy the dip, giving us the advantage of buying at a lower price

AAVE: Pullback in UptrendTrade setup : Price is in an Uptrend. It briefly broke above $115 and $125 resistance, making a Higher High (sign of Uptrend) but got overbought (RSI > 70) and pulled back. Now we wait for price to either 1) break above $115 to signal continuation of uptrend, with upside to $125 near-term, or 2) pull back near $95-100 support zone for a swing entry in Uptrend with upside potential back to $115 near-term and $125 medium-term.
Trend : Uptrend across all time horizons (Short- Medium- and Long-Term).
Momentum is Bullish (MACD Line is above MACD Signal Line and RSI is above 55).
Support and Resistance : Nearest Support Zone is $95, then $80. The nearest Resistance Zone is $115, which it broke, then $125.

$AAVE looking goodBINANCE:AAVEUSDT - in the process of breaking above a heavy long term support - if it can convincing take this level and flip to support - next serious resistances are at 132 and 157...
Not trading this yet but keeping a close eye...

#AAVEIn the 2-hour period, it is moving in a medium-term ascending channel, which after leaving the trading range area, it has climbed up to the ceiling of the channel. Therefore, by maintaining the middle range of the channel and a pullback to the area, it can retest the ceiling of the channel.

AAVE │ LONG (4H) │ 15.11.2023BINANCE:AAVEUSDT.P
Comment
The level's base is the point from which they started to update the local low.
The level was confirmed by a false breakout.
A nice approach.
Signals for level breakout
bar/candles closure near the level;
bar/candles closure near its high/low;
close retest of the level;
the instrument gradually approaches the level;
accumulation of energy for level breakout;
a good approach to the level;
there is a reserve of calculated ATR;
there is a reserve of technical ATR;
Signals against breaking the level
no consolidation before the level;
Order parameters (risk-to-reward ratio = 1 to 3/4/5)
Open : 95.29724;
Stop loss : 94.86104;
Take profit : 96.60584 / 97.04204 / 97.47824;
Disclaimer
Every trader should make their trading decisions based on their own analysis and circumstances. The signals in this channel should be considered as an additional tool for your own consideration.
Follow me and receive high-quality cryptocurrency market analysis!

AAVE inteligentassetRejected at 129 resistance, the upper limit of the channel and 800 ema
Bullish scenario
break up at 129
Next resistances at 158
Bearish scenario
114 support
Next support at 50 ema in the 97 area

AAVE/USDTEURONEXT:AAVE is looking strong on a daily chart; take an entry after flipping the zone to red and then enjoy. Always utilize a stop-loss order. Everything is on the chart.
Trust @TheCryptoCity1
Bitcoin CRYPTOCAP:ETH #XRC20 CRYPTOCAP:LTC Grayscale CRYPTOCAP:MATIC

AAVE starting bull after consolidationaave is completing accumulation phase it id one of lt which not pumped yet

AAVE: Pullback in UptrendTrade setup : Price is in an Uptrend. It briefly consolidated in a Bullish Flag pattern, broke out of it and reached $120. Now it’s pulled back to $95 support area, which could be a swing trade entry in Uptrend, with upside to $115 near-term and $125 medium-term. Stop Loss (SL) at $85 (prior swing low). Previously, following a bullish breakout from Channel Down pattern, price broke above 200-day moving average, which signaled a bullish trend reversal to an Uptrend.
Trend : Uptrend across all time horizons (Short- Medium- and Long-Term).
Momentum is Bullish (MACD Line is above MACD Signal Line and RSI is above 55).
Support and Resistance : Nearest Support Zone is $95, then $80. The nearest Resistance Zone is $115, then $125.

AAVE READY??Look like this coin will be start long bull run soon..
I see many sign from harmonic pattern here.. so.. lets see 😉

$AAVE starting pump!Ahead of time we need to see AAVE break out of the $115 resistance zone. If the price is supported by volume when crossing this area, we can expect a strong bull run from AAVE. My target would be $200 - $250.
