AAVE Nearing Key Resistance. Will Bullish Momentum Persist? Key indicators used for analysis:
1. Zero lag moving average (ZLMA): Refined form of moving average that reduces lag while maintaining smoothness.
2. Price Volume Trend (PVT): Tracks price movement weighted by volume
3. Relative Strength Index (RSI): A momentum oscillator indicating overbought and oversold conditions.
Support:$273.02
Resistance: $399.00
1.Price is trading above ZLMA9 and ZLMA51, signalling short and long term bullish momentum.
2.The PVT indicator is trending upward, reflecting strong volume-driven price increase.
3.RSI is forming higher lows, suggesting increasing strength in momentum.
Note: This is only for educational purposes and not a buy and sell recommendation. Teak Finance will not be liable for any loss or gain. Please consult your trading advisor.
AAVEUSDT trade ideas

AAVE - DeFi leader
As I have stated in my previous analysis AAVE is one of the leaders in DeFi sector, and stays quite underpriced still. Just as I predicted, it reached my target and now I think it will go for .618 Fib. After that in theory there also will be a correction.
But if you look at Solana chart, it has gained a lot of attraction in this cycle and has made a new ATH. I think AAVE will be one of the few Altcoins which have the required potential to make new ATH also. Let's hope and monitor

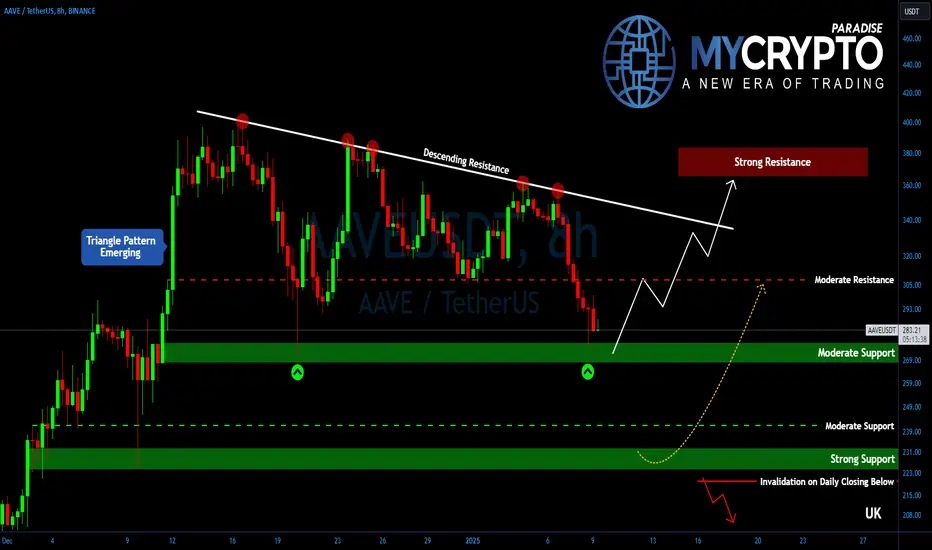
AAVE’s Next Big Move Is Coming—Are You Ready for the Reaction?Yello, Paradisers! After a powerful bullish rally, #AAVE is now cooling off, facing some heavy rejection. But don’t be fooled—this isn’t the end of the story. The market often needs a breather before gearing up for another big move, and that’s exactly what we see unfolding here. The question is: will the bulls step in at the right levels, or are we setting up for a deeper correction?
💎#AAVEUSDT is approaching a critical support range between $275 and $270, a level that has already proven itself twice by holding off sellers. This range is more than just a horizontal line on the chart—it’s backed by the 8-hour EMA-200, giving additional strength to the area. Bulls are expected to step in here, providing fresh demand to push the price higher.
💎However, if this moderate support doesn’t hold and sellers take control, things could get tricky. The next key level to watch is $240, with a stronger higher time-frame support between $230 and $225 waiting below. Testing this range would be a game-changer, likely turning the market sentiment bullish again.
💎On the flip side, AAVE continues to struggle with a descending resistance that’s keeping bullish momentum in check. This trendline sits around $335—a major hurdle for bulls to break through to trigger a hyper-momentum phase. But before that, there’s another critical level at $305. Clearing this area would already start to weaken sellers and shift the narrative in favor of the bulls.
💎If the descending resistance breaks, AAVE could quickly revisit its previous highs around $370 to $390. But caution is advised at those levels—expect profit-taking to kick in, as sellers will likely defend those highs aggressively.
Patience and discipline are key here, Paradisers. The market often tests both bulls and bears before making decisive moves, so stay vigilant.
MyCryptoParadise
iFeel the success🌴
AAVE/USDT at the Brink Will the Wedge Breakout Spark ?This is a daily chart of AAVE/USDT, showing a symmetrical wedge or descending triangle pattern formi
Pattern Structure
The chart shows a series of lower highs and higher lows, confined within two converging trendlines.
The price is approaching the apex of the structure, suggesting a potential breakout soon.
Current Price Action
The price is near the upper trendline at $360.06, indicating a test of resistance.
There is a recent rejection at the upper boundary, suggesting sellers are defending this level.
Trend
This is occurring within a larger bearish context (from the visible left part of the chart), as indicated by the lower highs in the pattern.
Key Levels
Resistance Around $405, corresponding to the upper boundary of the pattern.
Support Around $265, the lower boundary of the pattern.
Breakout Levels
A breakout above $405 could signify bullish momentum, targeting levels such as $465 or beyond.
A breakdown below $265 would open up the potential for a bearish move, possibly targeting $205 or lower.
Trading Considerations
Breakout Potential
A breakout above the resistance trendline would need to be accompanied by strong volume to confirm bullish sentiment.
Similarly, a breakdown below the support trendline should be confirmed with high volume for bearish continuation.
Risk Management
If entering a position near these boundaries, stop-loss levels should be placed slightly beyond the opposite trendline to minimize risk.
False breakouts are common in wedge patterns, so monitoring retests of breakout levels is crucial.
Market Sentiment
The sentiment in the cryptocurrency market and any fundamental news related to AAVE may influence the next move.

AAVEUSDT waiting for a break through 300.0AAVEUSDT is regaining its bullish outlook. The false breakdown of support was an invitation ticket for buyers, who returned to aggressive buying. There is important news ahead that could be a good driver for the coin.
Scenario: After liquidation and liquidity capture from support, the market switches to resistance. Taking into account the fact that globally we have a bullish trend, there is no sense in a false breakdown of resistance. Accordingly, the probability of breakdown and further growth is higher.
Before the level of 300.0 a consolidation is formed, which can provoke a breakdown of resistance and growth

Can #AAVE Bulls Push the Price Further or Not? Key Levels Yello, Paradisers! #AAVEUSDT is gearing up for a major move, but will it be a breakout to new highs or a collapse to lower levels? Let’s dive into the current setup of #Aave:
💎#AAVEUSD is trading within a Symmetrical triangle formation, a classic bullish reversal pattern often seen before significant price surges. Over the last few weeks, we’ve seen multiple liquidity sweeps at lower levels, where impatient traders got shaken out. These sweeps usually hint at a potential breakout, but confirmation is still key before making any decisive moves.
💎#AAVE faces strong resistance near $395.7, which aligns with the upper boundary of the falling wedge. For bulls to take control, the price must close above this level on the 8-hour timeframe. A breakout here could trigger a powerful rally toward the $550–$575 major resistance zone, where sellers are likely to step in.
💎On the other hand, the first significant support level sits at $275, an area where buyers have consistently entered the market. If this zone holds, it could serve as a springboard for the next upward move. If #AAVE closes below $275, the next major support lies at $224.
💎A close below $224 would signal a breakdown of bullish momentum, increasing the likelihood of a prolonged bearish phase. The bears will take control of the price movement and it will fall to lower support levels.
Stay focused, patient, and disciplined, Paradisers🥂
MyCryptoParadise
iFeel the success🌴

AAVEUSDT (Aave) Updated till 21-01-25AAVEUSDT (Aave) Daily timeframe range. despite market volatility its holding real strong for a while now. local support at 254.14 staying above this point can give it another push. all it needs a clean break above 383.76.

AAVE/USDTKey Level Zone: 345.00 - 348.00
HMT v4.1 detected. The setup looks promising, supported by a previous upward/downward trend with increasing volume and momentum, presenting an excellent reward-to-risk opportunity.
HMT (High Momentum Trending):
HMT is based on trend, momentum, volume, and market structure across multiple timeframes. It highlights setups with strong potential for upward movement and higher rewards.
Whenever I spot a signal for my own trading, I’ll share it. Please note that conducting a comprehensive analysis on a single timeframe chart can be quite challenging and sometimes confusing. I appreciate your understanding of the effort involved.
Important Note :
Role of Key Levels:
- These zones are critical for analyzing price trends. If the key level zone holds, the price may continue trending in the expected direction. However, momentum may increase or decrease based on subsequent patterns.
- Breakouts: If the key level zone breaks, it signals a stop-out. For reversal traders, this presents an opportunity to consider switching direction, as the price often retests these zones, which may act as strong support-turned-resistance (or vice versa).
My Trading Rules
Risk Management
- Maximum risk per trade: 2.5%.
- Leverage: 5x.
Exit Strategy
Profit-Taking:
- Sell at least 70% on the 3rd wave up (LTF Wave 5).
- Typically, sell 50% during a high-volume spike.
- Adjust stop-loss to breakeven once the trade achieves a 1.5:1 reward-to-risk ratio.
- If the market shows signs of losing momentum or divergence, ill will exit at breakeven.
The market is highly dynamic and constantly changing. HMT signals and target profit (TP) levels are based on the current price and movement, but market conditions can shift instantly, so it is crucial to remain adaptable and follow the market's movement.
If you find this signal/analysis meaningful, kindly like and share it.
Thank you for your support~
Sharing this with love!
HMT v2.0:
- Major update to the Momentum indicator
- Reduced false signals from inaccurate momentum detection
- New screener with improved accuracy and fewer signals
HMT v3.0:
- Added liquidity factor to enhance trend continuation
- Improved potential for momentum-based plays
- Increased winning probability by reducing entries during peaks
HMT v3.1:
- Enhanced entry confirmation for improved reward-to-risk ratios
HMT v4.0:
- Incorporated buying and selling pressure in lower timeframes to enhance the probability of trending moves while optimizing entry timing and scaling
HMT v4.1:
- Enhanced take-profit (TP) target by incorporating market structure analysis

AAVE Fake local pumpResistance gap has not been broken and in correlation with btc, btc has the fake pump

AAVEUSDTGiven the breakdown of the downtrend line with strong candles, I bought this currency once again at 333. Also, the Trump team bought this currency a moment ago. So, it is highly likely that the desired target can be reached. Good luck.
BINANCE:AAVEUSDT

AAVE Short-Term Outlook: Key Levels and Trade OpportunitiesBINANCE:AAVEUSDT is showing signs of bullish continuation on the 1-hour chart, with prices approaching the critical resistance zone at $353.55. A successful breach could lead to further gains toward $355.81 and $359.32, while support at $344.85 and $339.71 offers a buffer against downside risks.
The MACD histogram's sharp ascent into bullish territory reflects increasing buying pressure, and RSI levels suggest the market is approaching, but not yet overbought, conditions. This makes the current setup favorable for bulls, with cautious optimism for further price appreciation.
Long trades could target entries near $344.85, with stops just below $339.71 and profit targets around $355.81. Short positions might aim for quick reversals near resistance, with exits near the support levels.

AAVE Breakout Triangle PatternAAVE breakout triangle pattern
AAVE is one of the biggest DEFI on ETH ecosystem, so what do you think ?
Yes someone know something about the future, lets pump it

AAVEUSDTOn the 4-hour time frame, this currency is in a good buying zone. I'm buying it here and the target is shown in the image. For spot trading only.
BINANCE:AAVEUSDT

AAVE/USDT
CRYPTOCAP:AAVE is breaking out of a descending channel, signaling a bullish reversal setup. The price has reclaimed the $335.21 support level, confirming an entry zone for the next leg up 🚀.
Targets:
🎯 Target 3 (T3): $564.19
This bullish momentum indicates a strong continuation toward these key resistance levels 🔥.

Looking for long on AAVE on the retracement.Looking to add long on AAVE on the retracement. I will enter 40% at first enrtry and 60% on the second entry. Total risk will be 1R.

Technical Analysis of AAVE/USDT: Potential Wave PathThis analysis examines the wave structure of AAVE on the 4-hour timeframe. Based on Elliott Wave Theory and Fibonacci levels, the price appears to be in a corrective phase, with key support and resistance zones highlighted.
Key Insights:
Corrective Wave (ABC):
The price has entered a corrective movement in the form of ABC after completing the third bullish wave.
The support zone between $256–$235 is identified as a potential completion area for Wave 4.
Fibonacci Levels:
The 113% ($256.08) and 127.2% ($238.48) Fibonacci levels serve as key points for potential price reactions.
Wave 5 Completion:
Upon completing Wave 4 in the highlighted support zone, the price is expected to enter Wave 5.
The target for Wave 5 could extend beyond $500, depending on the strength of the bullish momentum.
Possible Scenarios:
Bullish Scenario:
If the price finds support in the $256–$235 zone and reverses upward, Wave 5 may initiate, continuing the bullish trend.
Bearish Scenario:
A breakdown below the $235 support zone, followed by consolidation, could alter the Wave 4 scenario and lead to increased selling pressure.
Conclusion:
AAVE is currently in a corrective phase, with the $256–$235 support zone serving as a critical level to watch for determining the next move. Traders should closely monitor price reactions at this level and utilize confirmation tools such as momentum indicators.
Share your thoughts in the comments, and don't forget to follow me for more detailed analyses!

Aave long to $301Just entered Aave long. I think its likely to retest the $301 level, maybe a bit higher between now and tomorrow.
Daily trend is down but at a low and 4hr structure shifted back bullish which is a good indication that we'll correct up soon.

AAVE Long or ShortAAVE/USDT 4H Chart Analysis:
🔑 Key Levels:
Support: 270.94 | 219.49 | 200.19 | 183.04
Resistance: 306.14 | 344.35
📈 Bullish Scenario:
If the price bounces from 270.94, it could target 306.14 and eventually 344.35.
📉 Bearish Scenario:
A break below 270.94 may lead to a drop toward 219.49, with further downside potential to 200.19 and 183.04.
🔍 RSI is near oversold territory. Watch the reaction at 270.94 for confirmation of the next move!
#AAVE #Crypto #AAVEUSDT

AAVE USDT#AAVE CRYPTOCAP:AAVE
AAVE has formed a strong consolidation pattern, indicating accumulation within the descending triangle 🧐
Price is approaching the key support zone at $232.28, showing potential for a strong rebound 📈
A break above resistance levels could trigger moves toward $392.45, $466.42, and $531.84 🎯
Bullish momentum is building, and this setup looks primed for a big move! 🚀

AVVE UpdateAVVE Update
This currency is similar to ZEC a little while ago I analyzed it
Example!
ZEC currency from the beginning of the year 2024 to the first half and below of the year, the price ranged between 15 and 31, and in the last month of 2024 it rose more than 5 times approximately
Also, AVVE currency and in the same months and at the same end of the year also rose about 5 times
Also now we have the two currencies rising at the same level again, multiples
Another example ZEC
$15 rise to about $80
AVVE
$73 rise to about $400
Now you have to review your goals and learn patience An example of these two currencies

57% pumpAAVE/USDT Chart Analysis 📊📈
Current Price Action:
The current price of AAVE/USDT is around $349.58. The price has been moving inside a symmetrical triangle pattern, indicating a potential breakout soon. 📉📈
Key Support Levels:
$293.23: Strong support zone that has held previously. 🛡️
Ascending Trendline: Price is respecting the upward trendline, suggesting bullish momentum. 📈
Key Resistance Levels:
$390.94: The next resistance level that needs to be broken for further upward movement. 🚧
$530.80: Major resistance target after a confirmed breakout. 🎯
Breakout Scenario:
A breakout above the $390.94 level could trigger a bullish rally towards $530.80, marking a potential 57% gain. 🚀📊
Technical Indicators:
Symmetrical triangle pattern forming. 📐
Price holding above the ascending trendline. 📈
Volume could confirm the breakout direction. 📊
Summary:
AAVE/USDT is approaching a critical breakout point. A successful breakout above $390.94 could lead to a bullish surge toward $530.80, while failure to hold the trendline support may see a retest of the $293.23 level. ✅
⚠️ Risk Management Tip: Always use stop-loss and manage risk accordingly!

AAVE;I just saw this, AAVE might be unable to break the $400 resistance for now and this move seems like a pullback to the lost support. So in that case $200 is possible before the next move to $500, but if it’s broken we can expect a new high which imo is unlikely to happen.

AAVE;I just saw this, AAVE might be unable to break the $400 resistance for now and this move seems like a pullback to the lost support. So in that case $200 is possible before the next move to $500, but if it’s broken we can expect a new high which imo is unlikely to happen.
