Alchemy Pay - May 2025Let’s see how this turns out.
This is not investment advice. Always do your own research!

ACHUSDT ShortThe ACHUSDT ticker has sharply deviated from both the 4-hour and daily EMA50 levels without undergoing a retest. I anticipate a price correction towards these EMAs within the next few days. Targets are marked on the chart.

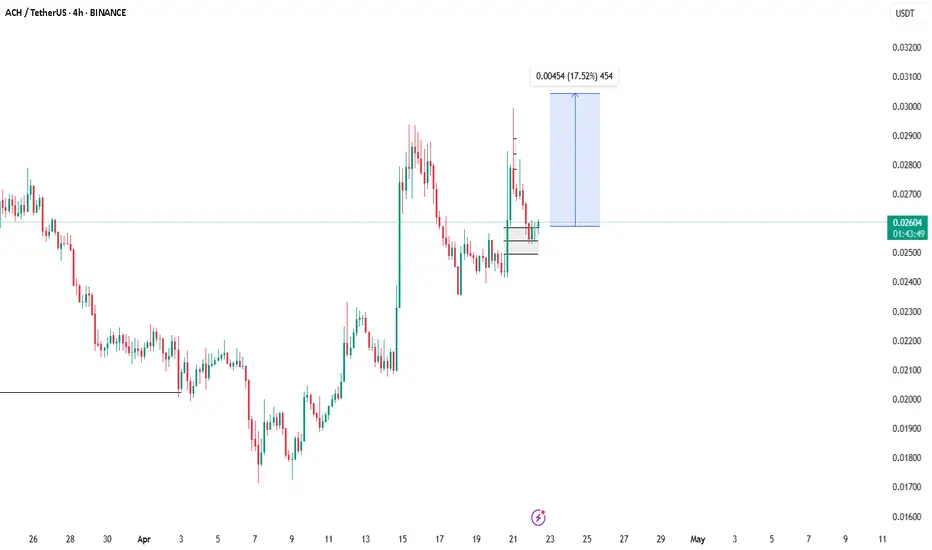
Alchemy Pay - April 2025Potential Bull Flag for ACH. Watch carefully. This chart is not investment advice. Always do your own research!

ACH/USDT Analysis – Joining the Long SideWe are considering a continuation of the long position on this coin through two scenarios:
a false breakout below the $0.02664 level,
or a test and reaction from the volume zone at $0.025–$0.024.

ACH/USDT - Potential Bounce Incoming 30%+ Gains PossibleI'm analyzing the ACH/USDT 4-hour chart and spotting signs of a potential rebound. Here’s what I’m seeing:
✅ Support Zone: Price is testing a key support level around $0.02119, which has held strong in the past. The market appears to be accumulating in this area.
✅ EMA Crossovers: The chart shows

Long Entry Signal for ACH/USDT - Bullish Setup (Daily Chart)
Symbol:
Timeframe: Daily
Analysis:
MLR > SMA: The MLR (blue) is above the SMA (pink), signaling a bullish trend.
MLR > BB Center: MLR exceeds the Bollinger Bands Center Line (orange), showing strong bullish momentum.
PSAR: PSAR dots (black) are below the p

ACHUSDT (1H) - Technical Analysis & Trade Setup📌 Market Overview:
The price is currently at 0.02783, forming a range-bound consolidation after an initial bullish move.
A potential breakout setup is visible, with an entry at the current market price (CMP).
The risk-to-reward ratio suggests a bullish trade setup with defined stop-loss and take-p

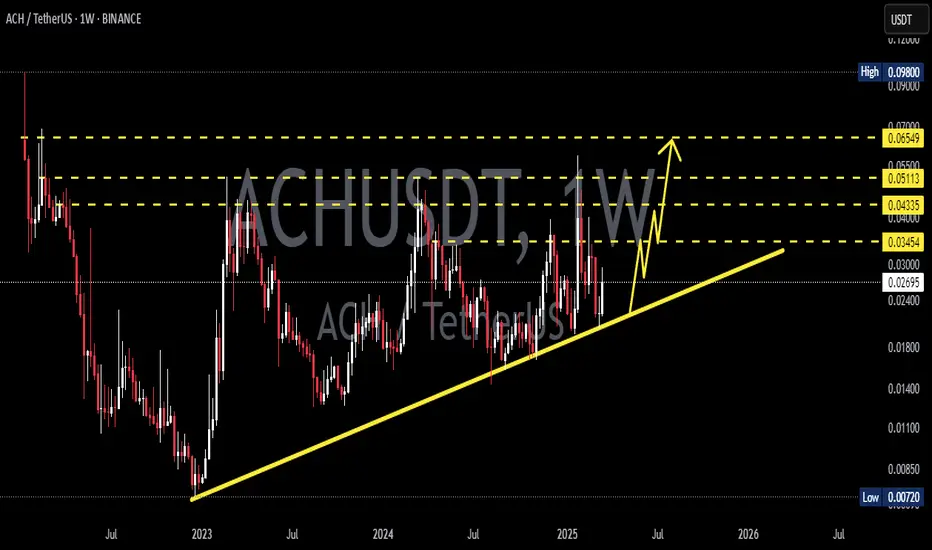
ACHUSDT 1WACH ~ 1W Analysis
#ACH This coin is still in a bullish trend. Buy when re -testing this support with a short -term target of at least 15%+.
Bearish opportunity in ACH1. We want price to at least head to the order blck meanthreshold
2. We have structure shift in H1
2. We have turtlesoup confirming liquidity grab
4. We are at H1 Orderblocks
ALTERNATIVE SCENARIO;
We have very clean buyside in 0.024228 and 0.024228 That pose a risk to downside orderflow

See all ideas
Summarizing what the indicators are suggesting.
Oscillators
Neutral
SellBuy
Strong sellStrong buy
Strong sellSellNeutralBuyStrong buy
Oscillators
Neutral
SellBuy
Strong sellStrong buy
Strong sellSellNeutralBuyStrong buy
Summary
Neutral
SellBuy
Strong sellStrong buy
Strong sellSellNeutralBuyStrong buy
Summary
Neutral
SellBuy
Strong sellStrong buy
Strong sellSellNeutralBuyStrong buy
Summary
Neutral
SellBuy
Strong sellStrong buy
Strong sellSellNeutralBuyStrong buy
Moving Averages
Neutral
SellBuy
Strong sellStrong buy
Strong sellSellNeutralBuyStrong buy
Moving Averages
Neutral
SellBuy
Strong sellStrong buy
Strong sellSellNeutralBuyStrong buy
Displays a symbol's price movements over previous years to identify recurring trends.