ADA → Cardano Pullback Followed by New Highs? Let's Answer.ADA completed its measured move to $0.68 and has now completed two legs down in a pullback to Support Zone #1. Should we long here?
How do we trade this? 🤔
Support Zone #1 has held through two failed attempts to break down. We have a strong bull bar leading into the Daily 30EMA where we are now seeing some resistance. The RSI is around 50 and above the Moving Average, another sign for a long position. The only thing we're missing is a solid Risk/Reward Ratio, which requires the price pullback a bit more before we can enter the market.
We ought to target at least a 1:2 Risk/Reward, but I believe we have the runway for a 1:3 Risk/Reward given the distance to the previous high of $0.68. Target the $0.487 area for an entry and place a stop loss below Support Zone #1 around $0.44, the first Take Profit at $0.535, and the final Take Profit around $0.63 or until you see a sell signal. Move the stop loss up to the entry price when Take Profit #1 is hit to lock in profits.
💡 Trade Idea 💡
Long Entry: $0.4875
🟥 Stop Loss: $0.440
✅ Take Profit #1: $0.535
✅ Take Profit #2: $0.630
⚖️ Risk/Reward Ratio: 1:3
🔑 Key Takeaways 🔑
1. Two-legged pullback after a bull run
2. Two failed attempts to break Support Zone #1
3. Strong bull bar after pullback into the Daily 30EMA
4. Wait for the price to pullback to the $0.487 area for an entry
5. RSI at 50.00 and above the moving average, supports long bias.
💰 Trading Tip 💰
Trends typically have 3 pushes in either direction before a trend change begins. Along with other market indicators, creates a situation to look for counter-trend trades because the probability of profit is high enough.
⚠️ Risk Warning! ⚠️
Past performance is not necessarily indicative of future results. You are solely responsible for your trades. Trade at your own risk!
Like 👍 and Follow to learn more about:
1. Reading Price Action
2. Chart Analysis
3. Trade Management
4. Trading Psychology
ADAUSD.P trade ideas

Uptrend | Cup and Handle
Overall Trend: The chart shows a general uptrend, as indicated by the higher lows and higher highs, especially noticeable from November to early December. This suggests that Cardano has been experiencing bullish momentum during this period.
Potential Patterns:
Cup and Handle: From the start of the chart up to November, there appears to be a rounding bottom, or a "cup," followed by a smaller dip that could represent the "handle" part of a cup and handle pattern. However, the handle typically shows a slight downward trend, whereas the chart shows more of a sideways movement. This pattern is usually a bullish continuation signal.
Resistance Break: In December, there appears to be a sharp upward movement that breaks past previous resistance levels, which may signal a strong bullish sentiment. This could have been an optimal entry point for a long position.
Consolidation: After the sharp rise in December, the chart shows a period of consolidation, with the price moving sideways with slight fluctuations. This consolidation period can sometimes precede a continuation of the prior trend or a reversal.
Volatility: There was a spike in volatility in December, as indicated by the sharp rise and subsequent falls. The price seems to have stabilized somewhat after that period, with fewer sharp rises or drops.
Current Position: As of the last visible part of the chart, the price appears to be on an uptrend, making higher lows, which could indicate bullish sentiment in the market.

Uptrend | Cup and HandleOverall Trend: The chart shows a general uptrend, as indicated by the higher lows and higher highs, especially noticeable from November to early December. This suggests that Cardano has been experiencing bullish momentum during this period.
Potential Patterns:
Cup and Handle: From the start of the chart up to November, there appears to be a rounding bottom, or a "cup," followed by a smaller dip that could represent the "handle" part of a cup and handle pattern. However, the handle typically shows a slight downward trend, whereas the chart shows more of a sideways movement. This pattern is usually a bullish continuation signal.
Resistance Break: In December, there appears to be a sharp upward movement that breaks past previous resistance levels, which may signal a strong bullish sentiment. This could have been an optimal entry point for a long position.
Consolidation: After the sharp rise in December, the chart shows a period of consolidation, with the price moving sideways with slight fluctuations. This consolidation period can sometimes precede a continuation of the prior trend or a reversal.
Volatility: There was a spike in volatility in December, as indicated by the sharp rise and subsequent falls. The price seems to have stabilized somewhat after that period, with fewer sharp rises or drops.
Current Position: As of the last visible part of the chart, the price appears to be on an uptrend, making higher lows, which could indicate bullish sentiment in the market.

AdausdI think is will be good month on ada usdt so we start with 0.89 target than we have another target 1.2

ADA-USD / 4H / TECHNICAL ANALYSIS Hello, BINANCE:ADAUSD coin is currently moving within an ascending channel. Breaking the 0.683 resistance is crucial for a genuine uptrend. If this level is breached, it signals the beginning of an upward movement.
Like and comment if you find value in our analysis.
Feel free to post your ideas and questions at the comments section.
Good luck

Cardano Ascending triangleEverything is int he chart. Wait for confirmation and retest before buying.

bullish flag going above 0.65 not only breaking the longterm resistance line but also can confirm the bullish flag with target around $1.8 ( target should be near the flagpole)
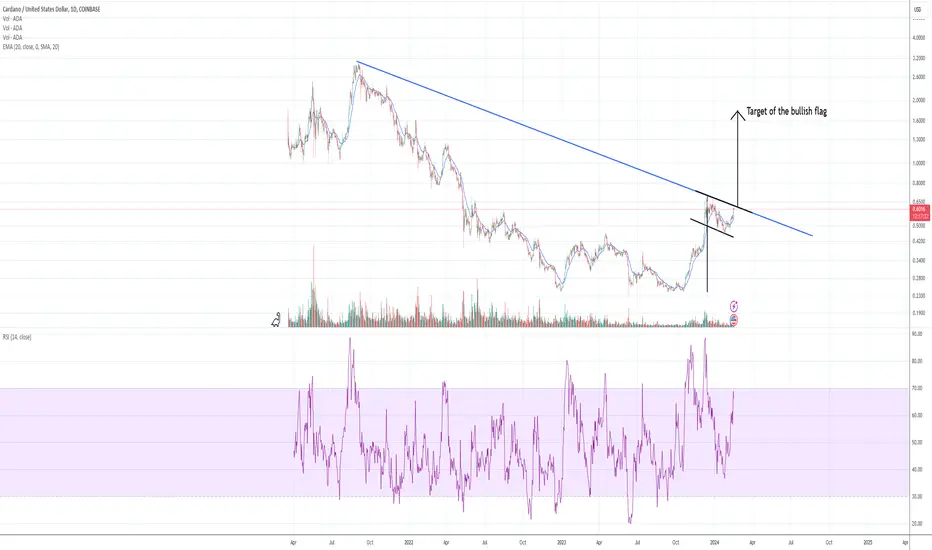
Importance of resistance line The real bullish movement will be when we break up the long term resistance line ;)

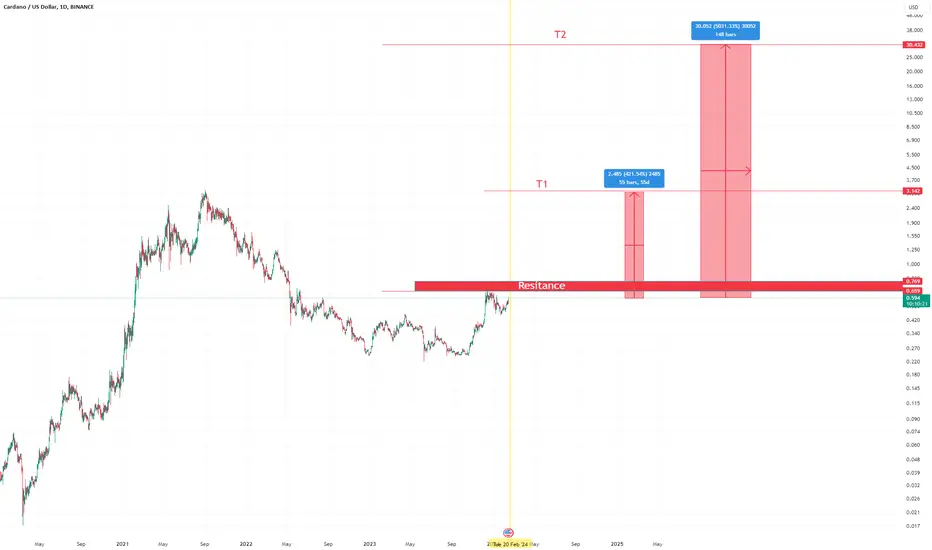
Ada log chartAda log chart done on daily.
If the growth is logarithmical and this is the "bull run" firs target would be at around $3.1 - that does not mean that it will hit target 2, on the previous ATH it hit just a tiny bit above T1 and rejected to the current lows.
Cardano #ADA: Chart Analysis on the Daily Chart 📊📈Taking a glance at Cardano BINANCE:ADAUSDT within the daily timeframe, we observe that Wave 1 and Wave 2 (in red) have already been completed since the beginning of 2023, and it appears that teh red Wave 3 is now also finished. Yes, I acknowledge that Wave 2 has minimally fallen below Level C – thank you for pointing that out.
Our entry point at Wave 4 at $0.457 was triggered and has performed quite well so far. It remains to be seen whether there will be further downward movements in the coming days.
Examining the 1-hour chart and noting the low at $0.44, we might assume that once we surpass Wave 4 (the very subordinate Wave 4 in black) – that is, above $0.52 – our current scenario with a 5-wave structure will continue. 📊📈🚀

ADA ShortADA price has been obeying my zone and still expecting further upside in price movement after minor consolidation at current minor support zone.

ADA Breakout#CARDANO ( BINANCE:ADAUSD ) nice breakout
1. Supertrend positiv
2. positiv accumulation
3. positiv squeeze

Cardano (ADAUSD): Fasten your seatbelts! 🚀📈Cardano emerges with a distinctive journey. Having sculpted Waves 1 and 2 within a Flat structure, the focus now shifts to the probable completion of Wave 3, reaching a potential range between 227% and 261%.
Anticipating the onset of Wave 4, we pinpoint a pivotal zone between 50% and 61.8%. A breach beneath this range would jeopardize the entire scenario, potentially falling into the territory of Wave 1. The support offered by Wave B within the Flat structure stands as a crucial level, poised to become a notable buy zone.
With these dynamics in play, we anticipate a surge to at least 90 cents!

ADA Short ScalpAfter a massive bullish move, i do see ADA should correct the move and it's happened on current level. I will SHORT the token for a few pips.

ADAUSDTWave b of Y has ended. The price should not move above 0.57. By maintaining these conditions, I expect a downward wave c from Y.

AFTER A BOUNCE AT SUPPORT LEVEL CARDANO STRENGHTENED!ADAUSD pullback to the support level at 0.45 and the crypto has made higher-high and higher-low, thus ready for bullish momentum!
N.B!
- ADAUSD price might not follow the drawn lines . Actual price movements may likely differ from the forecast.
- Let emotions and sentiments work for you
- ALWAYS Use Proper Risk Management In Your Trades
#adausd
#crypto

CARDANO - MY MOST BULLISH SCENARIO"This chart illustrates the trajectory of Cardano (ADA), projecting the patterns observed in the previous bull cycle onto the current one. As you may observe, we have surpassed the boundaries of the green zones, forming a supportive candle. Based on this observation, I anticipate a price increase of 4100% from the current level, reaching a peak within approximately 48 weekly bars, with a target of $19 by December 2024."

$ADAUSD broke through 50EMA looking bullish CRYPTOCAP:ADA broke through 50EMA and looking to do the typical run bouncing off 50EMA next and riding on 8EMA pointing to the 🌙 moon . Observe.

1D: Cardano/ADA - 30% Upside! Wya Bulls?Just some lovely ADA action on the daily. Beautiful confirmation low and now we await for the follow through price action. Crypto looking reallllly good.
Here comes the FOMO crowd again

Ada heikin ashi reversalif you know how heikein ashi works, well this is kinda bullish, the down trend is slowing down, and we could easily see a green heikin ashi bar path come up, a V shape return is very possible in my opinion too. And unlike the other currencies, ada dropped like 50%+ in the past couple weeks, and it's hitting major support, macd is ready for a cross and rsi is ready for a return, I really don't think it can go any further down. Bitcoin going back up definitely helps too.

ADA Price Eyes Channel Break For A Run To $1 Channel Breakout Event: ADA price is nearing a channel breakout event, indicating a bullish turnaround.
Crossing the 50-Day EMA: Cardano's price has crossed the 50-day EMA, setting the stage for a potential bull run.
Potential to Reach $0.66: If ADA sustains above the 38.20% Fibonacci level, it could shortly reach the $0.66 mark.
Trend Reversal Rally: A bullish reversal rally in the daily chart suggests ADA is gearing up for significant recovery.
Bitcoin's Influence on Cardano: Bitcoin's sustained recovery momentum positively impacts Cardano's market outlook.
Anticipation of "Post-Halving Rally": The upcoming Bitcoin halving event raises expectations for a broader market bull run, benefiting ADA.
Question of Reaching $10: Speculation about ADA potentially reaching the $10 mark.
Sharp Trend Reversal: The ADA price has shown a sharp reversal from overhead resistance in a falling channel pattern.
Current Trading Price: ADA is currently trading at $0.514, with a notable increase in intraday trading volume.
Technical Indicators - RSI: The daily RSI line indicates a growing demand, supporting the uptrend's momentum.
Cardano Network's Surge in Health: The increase in active users and transaction counts boosts network health and ADA's price potential.
Risk of Testing Lower Support: A drop below the current support trendline could lead ADA to test the $0.40 level.

ADA/USD Weekly: Examining Potential Wyckoff Reaccumulation
On the ADA/USD weekly chart, we've observed price action and volume changes that share characteristics with a Wyckoff reaccumulation pattern. While not definitive, let's explore these elements:
Selling Climax: A sharp price drop accompanied by high volume, potentially signifying selling exhaustion
Automatic Rally: A subsequent price increase without significant buying volume, possibly indicating weak hands exiting.
Spring: A brief price dip followed by a quick reversal, potentially testing support and attracting new buyers.
Signs of Strength: Recent higher closes and increasing volume, suggesting potential buying pressure.
However, remember:
Technical analysis alone shouldn't guide investment decisions.
This pattern interpretation is for educational purposes only.
Always conduct your own research, consider other factors, and consult a financial advisor before investing.
Discussion questions:
Do you see the same characteristics of a Wyckoff reaccumulation pattern?
How might this pattern evolve in the coming weeks?
What other factors should be considered before making investment decisions based on this analysis?
Disclaimer: This analysis is for educational purposes only and should not be considered financial advice. Always do your own research and consult a financial advisor before making investment decisions

Easy 10R Trade on CardanoCardano is experiencing incredibly on-chain metrics.
Energy use is a massive case factor with regards to the WEF and the next ETF for consideration.
I believe the bull hammer in convergence with the daily MACD cross alongside the bullish sentiment on crypto in the lead up to the halving event on BTC and, obviously, the institutional engagement post-ETF will lead us back to >$1 and potentially new all-time highs over the next few years.
