Forecasting Breakouts on ADAWelcome back to my learning series everyone. In this chart I discuss my opinion on a potential trade and breakout forecast for ADA. I do not have a bias for ADA, I am following a trading guide that I am adding my own analysis to, and the charts just happen to be ADA. Thanks everyone!
ADAUSD.P trade ideas

Identifying Trends on CardanoHello Everyone,
I have always had a passion for the markets (especially crypto) and I have decided to make it my career. I was a meteorologist in the military, which believe it or not, is very similar to chart analysis. I am producing charts in a learning series that I would really like to receive feedback on from the pros here, and I hope I can also assist those who are also new to trading!
This chart will be identifying trends on Cardano. Feedback is greatly appreciated. Thank you everyone!

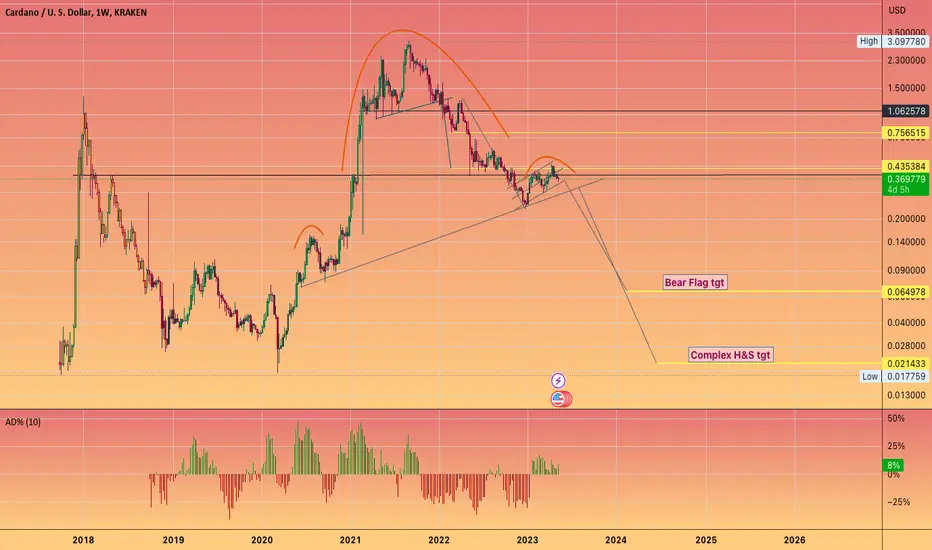
Too obvious Cardano head & shoulders?Cardano could be going slowly down another 12% until end of June. I would not be surprised that is the case, but at the same time it seems too obvious path. To me, TOTAL3 (#altcoins) has another leg down that can occur faster than that, and then I foresee a rebound during next month. Maybe not for ADA though....

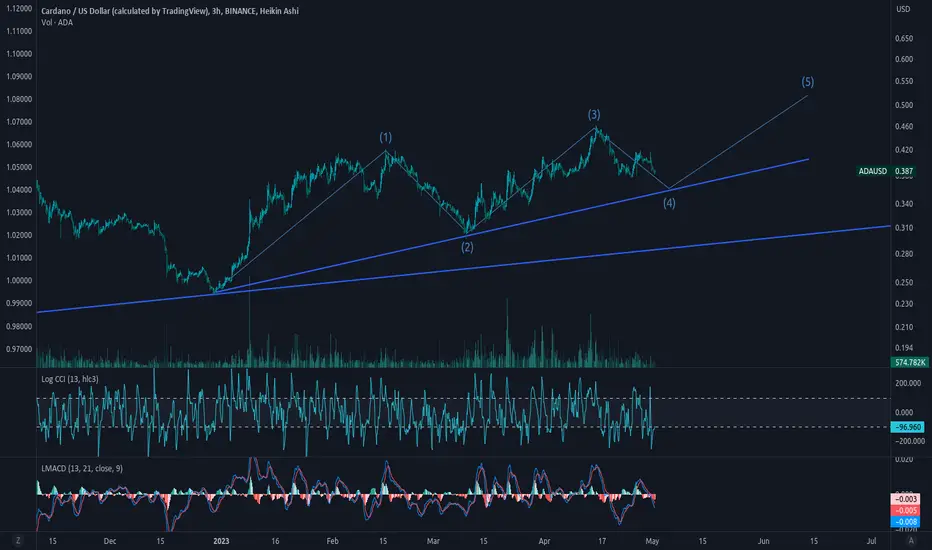
ADA Elliot wave Elliot wave projection for Cardano forming higher highs and higher lows bouncing on trendline kicked off beginning of 2023
ADA long- still waitingstill waiting for the upward movement to take place.
no major updates.
let us give it 3 to 5 days.

ADA long trade executeda historical movement from january 2022 might be repeating in real time.
protect your self with the stop loss and risk management.
for me, i risk between 7.5% to 15% per trade.
because i execute from 1 to 3 trades a month, maximum.

Cardano: Winnie the Pooh 🍯Like the honey-loving bear Winnie the Pooh, Cardano should grab deeper into the orange-golden honeypot between $0.39 and $0.31 to finish wave (ii) in blue. Although the main requirements to conclude the current movement have already been fulfilled by touching at the orange zone and Cardano could thus take off anytime, we rather expect the altcoin to advance ideally until the 100.00%-retracement at $0.34 before turning upwards. As soon as wave (ii) in blue is indeed complete, our crypto-friend should expand wave (iii) northwards.

Ada(based on NEo wave)I think this is zigzag correction and this is the end of the branch.(for now!) I think this is more complicated correction and we should wait for it to show itself.

ADA (Cardano) lets take some profit on short for now.#ADA /USD TA Update:
CRYPTOCAP:ADA currently trading at $0.3594
According to Coinlion Trend Trader Indicator, we got en Exit Point Alert for ADA at $0.4 (04/21)
Coinlion Trend Trader Indicator entered short at 0.3864 the 4th of may.
Then takes 2 times Profit :
1) $0.365 (20% exit position)
2) $0.362 (10% exit position)
(6,5% Profit).
There is a strong resistance at the 200EMA. The same which has rejected ADA many times before
But we have broken the descending channel.
Now we have a support on the 200SMA at $0.352 and a liquidity zone support between $0.2986 and $0.30
Cardano can test again the channel which should be a support now aligned with the 200SMA and 50SMA around 0.357
+ we can see that ADA is oversold. The trend might change soon as whales are accumulating a lot ADA.
Lets see what happens and follow the indicator instead of our emotions.
What do you think ?
Please click LIKE button and Appreciate my work.
Coinlion Trend Trader indicator tells me
- When to enter short or long
- When to exit and take profit :-)
- Now CTT comes with the new RSI and Stochastic indicator
IF YOU WANT we can give you the link to our free indicators :
- Stop Loss indicator
- Liquidity Support and Resistance Indicator
- Buy and Sell signal
- Automatic Fibonacci Levels with Higher and Lower Lows
Thank you.

#ADA doomsday scenario cast!Inherent in the risk of buying your favourite #crypto
is to watch fade into non- relevance
coupled with a non event #BITCOIN halvening which will happen one day!
Just throwing out a what if scenario for #cardano
those levels yielded a wonderful opportunity twice before,
could it be a third time?
Ada longBouncing off the golden pocket from the fib
Daily on stoch. Looks primed to move
Still respecting the trend
Going long here

DestinyIt is very important to buy some of this currency every month, don't worry about the price, because in the future these prices will be remembered and will definitely touch the $40 range.

CARDANO (ADAUSD): Very Bearish Setup Explained
ADAUSD formed a huge head & shoulders pattern on a daily.
Forming the right shoulder, the price also made a descending triangle pattern.
Both the triangle and the h&s had the same neckline.
It was broken yesterday and a daily candle closed below that.
I believe that the coin may drop lower now.
Goals: 0.346 / 0.325
❤️Please, support my work with like, thank you!❤️

ADA BULLISH IDEA (DOUBLE BOTTOM)Potential Bullish Entry Dow Theory In Place -
Higher High and Higher Low Expected in Place
Formation of DOUBLE bottom coupled with bullish divergence (Bullish reversal pattern)
SL & TP Levels are defined.


Trade ADA/USDTCryptocurrency traders have been keeping a close eye on the dominance of altcoins in the market. However, recent trends indicate that altcoins dominance is decreasing due to vertical and horizontal resistance. This has been coupled with the continued bleeding in the market, which is creating a perfect opportunity for traders to short ADA.
BTC dominance is experiencing a bullish retest, which is an indicator of a bullish market trend for Bitcoin. This trend is likely to have a significant impact on the value of other cryptocurrencies, including ADA. As altcoins continue to experience decreasing dominance, it is becoming increasingly clear that traders should be cautious when investing in these assets.
Shorting ADA at this time presents an excellent opportunity for traders to profit from the current market conditions. With the dominance of altcoins on the decline, it is becoming increasingly challenging for these assets to gain value in the market. As such, a short position on ADA could yield substantial returns for traders.
In conclusion, with the current market trends indicating a decrease in altcoin dominance, coupled with the continued bleeding and bullish retest of BTC dominance, shorting ADA presents a viable trading opportunity. Traders should take advantage of this opportunity to profit from the current market conditions and maximize their returns.

Cardano Drop Incoming 50 and 200 EMA are negative.
Clear head and shoulders pattern has formed.
Price is struggling at the current support line.
Lower time frame you can see a break below the support line.
Price expected to drop 30%.
Targets set at $0.302
For long term holders buy in that range.

ADA short signalA historical pattern from November/ December 2022 might be repeating in real time.
place your stops, and lets wait and see what will happen.

Cardano: chasing oversold sideDuring the previous week ADA clearly started its reversal move. The support line at $0.40 had been clearly broken at the beginning of the week, and the coin continued its road down to its minimum weekly level at $0.37. Selling orders are prevalent at the end of the week, in which sense, it might leave some space for further drop in price until a clear oversold side is reached.
During the whole week, RSI was moving below level of 50, finishing the week around 42. This is another indication that the market is chasing an oversold side. Moving average of 50 days is slowing down its divergence from MA200, putting into question the formation of the Golden cross.
Current charts are clearly pointing that ADA is on the road toward the oversold side. Current price fall stopped shortly around $0.38 level; however, it should be treated as only a short term stop for ADA, on a road toward the $0.35 support line. There is some probability that this level might be reached during the week ahead. On the opposite side, there is a low probability that $0.40 resistance might be tested.

ADAUSD 7May2023with prices that are quite cheap now and supported by analysis which illustrates that prices tend to fall again due to corrections, there's nothing wrong with waiting for an opportunity to be able to take even cheaper prices in the next few days

BTC, ETH ADA, XTZ and NEO price forecasting and possible entriesWe are approcaching the time to get some entries preparing for crypto bull run as we are approaching Bitcoin halving that normally moves the market a lot. This is just my analysis and not a financial advice

ADAUSD (Daily) - Bearish reversalHi Traders
ADAUSD (Daily Timeframe)
Waiting for the downward break of 0.377 support level which will complete a bearish trend reversal pattern to go SHORT. Only the upward break of 0.419 would cancel the bearish scenario.
Trade details
Entry: 0.377
Stop loss: 0.439
Take profit 1: 0.350
Take profit 2: 0.307
Score: 7
Strategy: Bearish reversal

ADAUSD - BULLISH DIVERGENCENo new lower low was formed and breaks the previous lower high as indication of trend change and secondly bullish divergence was also found
