
BUY SCALPING SPOT AIUSDT SIGNAL🚀 BUY SCALPING SPOT AIUSDT SIGNAL
📢 Short-term scalping opportunity for AIUSDT – Quick execution for optimal gains!
📌 Strategy & Trade Plan
✔ Scalping Spot Trade within 1-2 days
✔ Targeting 30-35% profit, exit quickly when the target is reached
✔ Signal expires automatically after 2-3 days if the
AIUSDT 3DAI ~ 3D Analysis
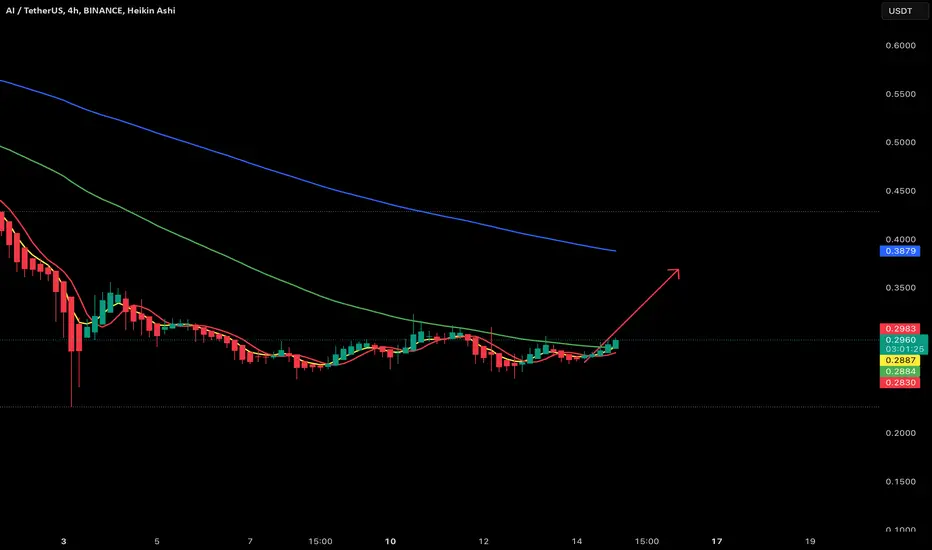
#AI This is the lowest support block for now, buy from here if you still have a Conviction on this Coin with a minimum target of 15%+

AI TOKEN: MAJOR ACCUMULATION COMPLETE - BREAKOUT IMMINENT $AI/USDT 1D Analysis
🎯 STRONG ACCUMULATION PATTERN
Current Status:
• Price: $0.6059 (-0.08%)
• Volume: 5.45M
• Rising trendline support (gray)
• Major resistance: $0.8-1.0 (descending line)
KEY ZONES:
• Historical ATH: $1.60-1.80
• Accumulation: $0.35-0.45 (completed)
• Current Support: $0.60
F

AI Analysis (1D)It seems the AI is completing an expanding pattern in the form of wave b of B.
The red zone is where wave C of this expanding pattern, which is a diamond-shaped diametric, could potentially end.
The safe zone for rebuying is the green zone, which acts as an ideal order block.
Trigger a position w

Alikze »» AI| Bullish Scenario - 1H🔍 Technical analysis: Bullish Scenario - 1H
📣 BINANCE:AIUSDT
🟢 If this price reversal meets support and reversal to the green box area and the Invalidation LVL bar is not touched. The currency correction is complete.
🟢 In the medium term, it will be ready to continue the upward rally.
🟢 If t

TradeCityPro | AIUSDT Attempting to Break the Daily Box👋 Welcome to TradeCityPro Channel!
Let’s analyze one of the coins in the AI and big data category to stay prepared if the AI hype resurfaces.
🌐 Overview Bitcoin
As usual, before analyzing our altcoin, we’ll first take a look at Bitcoin on the 1-hour timeframe. The 99.485 trigger was broken but

AI/USDT Buy setup free signal from meYou can buy hand hold here on the support area BINANCE:AIUSDT.P

AIUSDTusing spranzo model of 123 as AIUSDT will finish 1 and 2 and prepared to go for 3 and break all other tops
its going bullish and lets see

#AI/USDT #AI
The price is moving in a descending channel on a 30-minute frame and is expected to continue upwards
We have a trend to stabilize above the moving average 100 again
We have a descending trend on the RSI indicator that supports the rise by breaking it upwards
We have a support area at the low

See all ideas
Summarizing what the indicators are suggesting.
Oscillators
Neutral
SellBuy
Strong sellStrong buy
Strong sellSellNeutralBuyStrong buy
Oscillators
Neutral
SellBuy
Strong sellStrong buy
Strong sellSellNeutralBuyStrong buy
Summary
Neutral
SellBuy
Strong sellStrong buy
Strong sellSellNeutralBuyStrong buy
Summary
Neutral
SellBuy
Strong sellStrong buy
Strong sellSellNeutralBuyStrong buy
Summary
Neutral
SellBuy
Strong sellStrong buy
Strong sellSellNeutralBuyStrong buy
Moving Averages
Neutral
SellBuy
Strong sellStrong buy
Strong sellSellNeutralBuyStrong buy
Moving Averages
Neutral
SellBuy
Strong sellStrong buy
Strong sellSellNeutralBuyStrong buy
Displays a symbol's price movements over previous years to identify recurring trends.