ALGO NEXT TARGET??#ALGO
EURONEXT:ALGO Algorand is currently retesting the $0.20 level after breaking out of a falling wedge pattern on the daily chart🔍
A successful bounce could trigger a continuation of the bullish rally with targets at $0.24, $0.30, $0.40 and $0.50🚀

ALGOUSDT short-term predictionhi traders,
ALGOUSDT has been traded in the downsloping channel, and now it looks like the breakdown is occurring while I'm creating this publication.
I'm bullish on ALGO long-term, but a short-term 8 % drop is expected.
As the breakdown is just happening, you can enter short now.
Stop loss: 0,21

Is ALGORAND going to reach 2.550?Algorand has broken through a key resistance at 0.3300. This signals the start of a new bullish trend on the weekly timeframe. Currently, the price is moving within the buying zone of an Andrews Pitchfork, which presents a potential setup for buyers.
The ideal strategy is to wait for a retracement

Algorand (ALGO): Market Structure Break | Getting Ready to ShortAlgorand seems to form a proper MSB formation where we might catch a good downward movement once we see either a breakdown from current zones or a successful re-test from EMAs on a 30M timeframe.
More in-depth info is in the video—enjoy!
Swallow Team

TradeCityPro | ALGO: Key Levels in RWA Coin’s Bullish Revival👋 Welcome to TradeCity Pro!
In this analysis, I’m going to review the ALGO coin for you. This project is one of the RWA (Real World Assets) crypto initiatives, which saw significant growth during the recent hype around this category.
💫 Currently, the market cap of this project stands at $1.99 bill

Algorand 1D started Bullish Trend for over 100% GainAlgorand could reach higher targets in the future by breaking the correction line.

$ALGO | #3D Macro Outlook #long📌 Setup:
— Ideal entry: retest of 0.618 fib ($0.167–0.172)
— Targets: $0.29 / $0.34 / $0.42 / $0.56
— Invalidation: daily close below $0.165 on volume
⚙️ Triggers:
— Retest + bounce from $0.167 zone
— Strength in CRYPTOCAP:BTC
— Increasing volume + demand confirmation
Midterm potential: +100–150

ALGO/USDT Technical Analysis Deep Dive! Let’s break down this ALGOUSDT chart step-by-step — it’s a perfect example of trading patterns in action!
🏄♂️ Timeline (Aug 2024 - April 2025):
▸ Accumulation (Aug - Nov 2024): ALGO consolidates between $0.1050 and $0.1450, showing low volatility. This is a classic accumulation phase where b

Long ALGOLong ALGO trade idea,
good entry at 0.2045
TP1 .3045
TP2 .41
TP3 .6545
Depending on position size and risk apatite position could run until new highs before TP
SL below 0.17

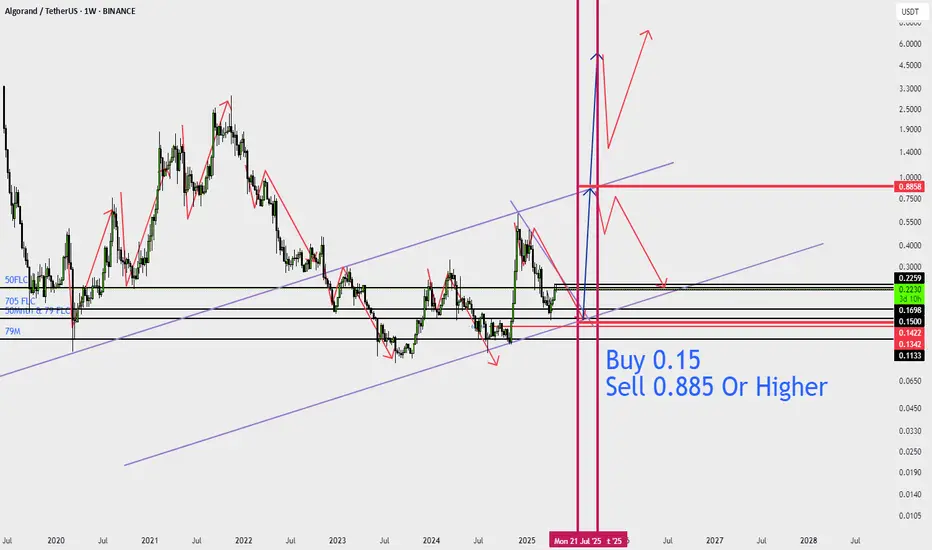
Buy 0.15 Sell 0.885 Or HigherMy opinion is evident in my paintings.
If we follow the history of price movements, we can guess the general trend, but there are various situations that can change this trend, for example, a very large Bitcoin pump, due to which the market cap of other markets and the price are subject to changes,
See all ideas
Summarizing what the indicators are suggesting.
Oscillators
Neutral
SellBuy
Strong sellStrong buy
Strong sellSellNeutralBuyStrong buy
Oscillators
Neutral
SellBuy
Strong sellStrong buy
Strong sellSellNeutralBuyStrong buy
Summary
Neutral
SellBuy
Strong sellStrong buy
Strong sellSellNeutralBuyStrong buy
Summary
Neutral
SellBuy
Strong sellStrong buy
Strong sellSellNeutralBuyStrong buy
Summary
Neutral
SellBuy
Strong sellStrong buy
Strong sellSellNeutralBuyStrong buy
Moving Averages
Neutral
SellBuy
Strong sellStrong buy
Strong sellSellNeutralBuyStrong buy
Moving Averages
Neutral
SellBuy
Strong sellStrong buy
Strong sellSellNeutralBuyStrong buy
Displays a symbol's price movements over previous years to identify recurring trends.