ALGOUSDT.1DExamining the ALGO/USDT chart, there are several crucial points to consider from a technical perspective:
Technical Analysis
Resistance and Support Levels (R1, R2, S1):
The ALGO/USDT trading pair is currently navigating through a challenging phase, having experienced significant pullbacks from its recent highs near the R2 level at $0.2336.
The price is oscillating around the R1 level at $0.1672, which now serves as a key resistance level. A decisive break above this level could signal a shift towards a bullish sentiment.
The chart indicates a critical support level at S1 ($0.0834). This support has been tested multiple times, suggesting it is a significant level for the pair.
MACD Indicator:
The Moving Average Convergence Divergence (MACD) is below the signal line, reflecting ongoing bearish momentum. The widening gap between the MACD line and the signal line underpins this bearish outlook.
The histogram remains in the negative territory, which corroborates the strength of the prevailing bearish trend.
RSI:
The Relative Strength Index (RSI) is hovering just above the oversold territory, indicating that while there is bearish pressure, the market could be nearing a point of reversal if it enters and rebounds from oversold conditions.
Conclusion
The ALGO/USDT chart depicts a market currently under bearish control as evidenced by the resistance levels and MACD readings. The proximity of the price to the critical support at S1 suggests that this area could be pivotal. If the price sustains above S1, there might be potential for consolidation or a mild recovery, especially if the RSI shows signs of a turnaround from oversold conditions. On the other hand, a break below S1 could intensify selling pressures, potentially leading to new lows.
Given this analysis, my approach would involve closely monitoring the S1 level for any signs of a breach which would necessitate reassessing any long positions. Conversely, a rebound from this level could offer a strategic entry point for a short-term bullish trade, particularly if accompanied by positive divergences in MACD and RSI, signaling weakening downward momentum.
ALGOUSDT trade ideas

ALGOUSDT Elliott Waves AnalysisHello friends.
Please support my work by clicking the LIKE button👍(If you liked). Also i will appreciate for ur activity.
Everything on the chart.
Entry: market and lower
Targets: 0.3 - 0.5 - 0.7 - 1
after first target reached move ur stop to breakeven
Stop: (depending of ur risk).
ALWAYS follow ur RM
RR: 1 to 20
risk is justified
It's not financial advice.
DYOR!

ALGO LONGAlgorand currency has formed an inverted head and shoulder pattern and will grow by 300% from this range BINANCE:ALGOUSDT BINANCE:ALGOUSDT COINBASE:ALGOUSD

ALGO Analysis: Identifying Key Levels✨ Welcome to my channel. Here, we analyze a new crypto project or Forex pair every day.
📅 Let's dive into today's analysis, focusing on the ALGO coin in the crypto market.
🗂 About the Project: ALGO is a blockchain-based project with its own ecosystem and blockchain. It is one of the popular networks for DeFi enthusiasts, and if you're interested in this space, you're probably familiar with this blockchain.
⌛️ Weekly Timeframe
In this timeframe, ALGO experienced a significant downward movement, currently stabilizing around $0.1572. The price has tested the $0.1547 support level multiple times. The volume has been fluctuating, showing signs of both accumulation and distribution phases.
📈 If the price is supported and candles stabilize above the $0.1547 area, we can confirm that the price trend has potential for a bullish reversal. The main resistance for confirming an upward trend is at $0.2808. For ALGO to have a significant pump, the price must stabilize above this area, allowing you to enter a buying position according to your trading strategy after confirmation.
📉 If the price returns below $0.1547, the next significant support is at $0.0992, indicating a continuation of the bearish trend.
📊 In both scenarios, candle volume must confirm the price movement, and there should be no volume divergence; otherwise, the trend will not be healthy.
⌛️ Daily Timeframe
In this timeframe, you can see more details of the price movement. As indicated, the price ranged for a long period on the $0.1502 support and, after a breakout and pullback, initiated another downward wave to the $0.1297 area. Currently, there is significant bearish momentum in this timeframe, and the volume aligns perfectly with the downward trend.
Given the strong support at $0.1502, we can expect another bearish wave if candles stabilize below this area.
⌛️ 4-Hour Timeframe
In this timeframe, the price has pulled back to the $0.1605 resistance. Volume is gradually decreasing, indicating that the long-term downward trend impacts the 4-hour timeframe. This upward movement offers a potential entry point for a short position.
🔑 Key Levels: For a long position, the key levels are $0.1716, $0.1989. For a short position, $0.1502, and $0.1297 are critical areas where the price may react in the future.
💥 RSI Oscillator: The RSI is ranging between 45.73 and 51.84, and breaking either of these levels can provide confirmation for opening positions. However, be sure to use these levels only for confirmation and rely on candles to find the trigger.
🎲 My Strategy: Given the bearish market in the 4-hour and daily timeframes and the potential trend change in the weekly timeframe, I prefer to open a short position on this coin as I always trade in the direction of the momentum. However, there's no necessity for you to do the same; everyone should trade based on their strategy and plan. This is a personal decision, and each trader must find their strategy.
⚠️ Please note that this is not financial advice. I'm simply introducing this project to you, and remember always to do your own research.
🫶 If you found this analysis helpful and want to support me, please boost this analysis. Feel free to leave a comment or suggest a coin you'd like me to analyze next.

Wanna Hold Algo? Do it!4H chart
......
All the triggers and structure illustrates a strong bullish volume on Algo,
if another crash happens on market, Algo on 0.13$ will be a golden opportunity...

#ALGO/USDT#ALGO
The price of our channel is moving downward on a 12-hour frame, and it has been breached to the upside and is rising from the current levels.
We have a bounce from the lower border of the channel from the support area at 0.1200
We have a tendency to stabilize above the Moving Average 100
We have an uptrend on the RSI indicator that is heading up
Entry price is 0.1500
The first target is 0.1750
The second goal is 0.1900
The third goal is 0.2080

ALGOUSDT is BullishPrice was respecting the declining the descending trendline, however the bullish RSI divergence on daily time frame signaled that bulls are trying to win control of the price action, and the break of trendline and previous lower high confirmed it. Price has defined a higher high and if the bullish momentum sustains we can expect a bullish rally as per Dow theory. Targets are mentioned on the chart.

Algorand on its way to challenge the last overhead resistanceAlgo is is gearing up to challenge its overhead resistance; the last one remaining in this cycle. I believe this will happen sometime in June/July. Things will ramp up suddenly after that.

ALGORAND SETS TO JOIN THE BULLRUN BUT AFTER 20% NUKEThe Other Elliott Wave Count
BINANCE:ALGOUSDT shows a classical Head & Shoulder Pattern but as an Elliott Wave Trader I see it as a potential Truncated Head & Shoulder and wave 2 about to end.
When this wave 2 ends I am expecting ALGORAND to begin it bullish run for the ALT SEASON. At least a x2-5 200 - 500% is guaranteed.
Entry is anywhere in between the box and the 618 to 786% Fibonacci level while the invalidation level is at the ALL TIME LOW and the first target is $0.456 presenting us with a 6 Risk Reward Ratio.
Remember the PSYCHOLOGY behind this incoming bull run as I have explained before. now many traders are frustrated as much as the bulls and the bears are confused but as price keeps going down the bears will affirm their bias and the bulls hope will begin to shift to being bears just like when BINANCE:BTCUSDT was at 16k and then boom.
OTHER ANALYSIS
BINANCE:ALGOUSDT
BINANCE:ADAUSDT
BINANCE:PIXELUSDT
BINANCE:APEUSDT
BINANCE:NOTUSDT

ALGO | BUY CALLALGO has formed bullish divergence on last swing low and is trading above its falling trendline and HORIZONTAL ZONE.

ALGO Confirmed a Bullish Wedge PatternALGO Confirmed a Bullish Wedge Pattern
During these days ALGO confirmed a bullish wedge pattern signaling the beginning of a
bigger bullish wave.
The breakout from the pattern looks solid and it keeps printing green candles so far.
Any small correction is expected before the price resumes the bullish move again.
Expected resistance zones 0.1900; 0.2400 and 0.3000
You may find more details in the chart!
Thank you and Good Luck!
❤️PS: Please support with a like or comment if you find this analysis useful for your trading day❤️

ALGOUSDT 1D#ALGO has broken out of the falling wedge pattern on the daily chart and is now facing the MA50 and Ichimoku cloud. We are bullish on it. The targets are:
$0.1968
$0.2223
$0.2477
$0.2838
$0.3299

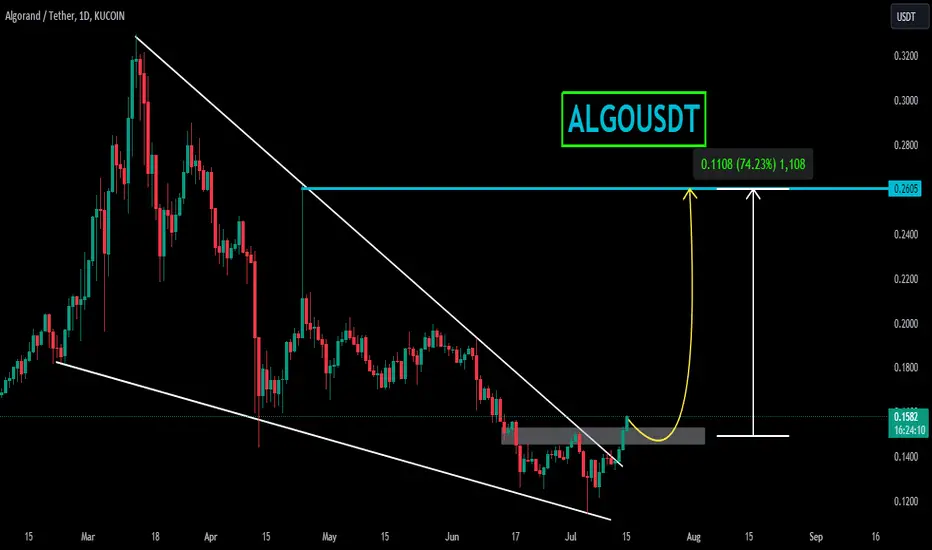
ALGOUSDTALGOUSDT.
Will ALGOUSDT get bids from buyers ?
As the price is at strong support level and bullish divergence indicating the buyers may attack this zone. If this happens and buyers start buying from here then the next target could be 0.2600 followed by 0.300
What you guys think of this idea?
ALGOUSDT 1WALGO ~ 1W
#ALGO Make gradual purchases within this support block, with a short-term target of at least 20%+

ALGOUSDTThis is my price prediction based on my technical knowledge on altcoin crypto market and this is not FA please do your own diligence Thanks!

Pigs get slaughteredWake up Grab a brush and put a little makeup Hide your scars to fade away the shakeup Why'd you leave the keys upon the table?

Perfect entry zone ALGOIt need a bit of time, but finally Algorand entered the buy zone I was waiting for. We can see a nice accumulation inside this zone and actually the price is trying to break out from this zone. I expect a move to the upside in the coming weeks, targeting $0.28

ALGO/USDT Weekly Chart UpdateHello everyone, I’m Cryptorphic.
For the past seven years, I’ve been sharing insightful charts and analysis.
Follow me for:
~ Unbiased analyses on trending altcoins.
~ Identifying altcoins with 10x-50x potential.
~ Futures trade setups.
~ Daily updates on Bitcoin and Ethereum.
~ High time frame (HTF) market bottom and top calls.
~ Short-term market movements.
~ Charts supported by critical fundamentals.
Now, let’s dive into this chart analysis:
ALGO on this weekly timeframe has been in a downtrend since March 2024. The price is already down by 60%, and if the market goes bearish, ALGO is likely to drop a further 48% to 50%.
The only bullish scenario for ALGO is to break above the 50 EMA and the resistance trendline.
Key Observations:
~ Support/Entry: $0.076 to $0.0909
~ Resistance: $0.1905
~ Higher Rallies: $0.2817, $0.4679, $0.8280, $1.5124, $2.3825, $3.44.
DYOR. NFA.
Please hit the like button to support my content and share your thoughts in the comment section. Feel free to request any chart analysis you’d like to see!
Thank you!
#PEACE

ALGOUSDT - Bullish divergence, rising wedge breakoutNext couple of days are quite bullish for ALGO!!
Algo has gone through a depression phase in last couple of months, signs of reversal.
The structure hasn't broken, Expect a 50% to 80% ride easily.
Key levels are define to take profits and keeps your trades in profits..

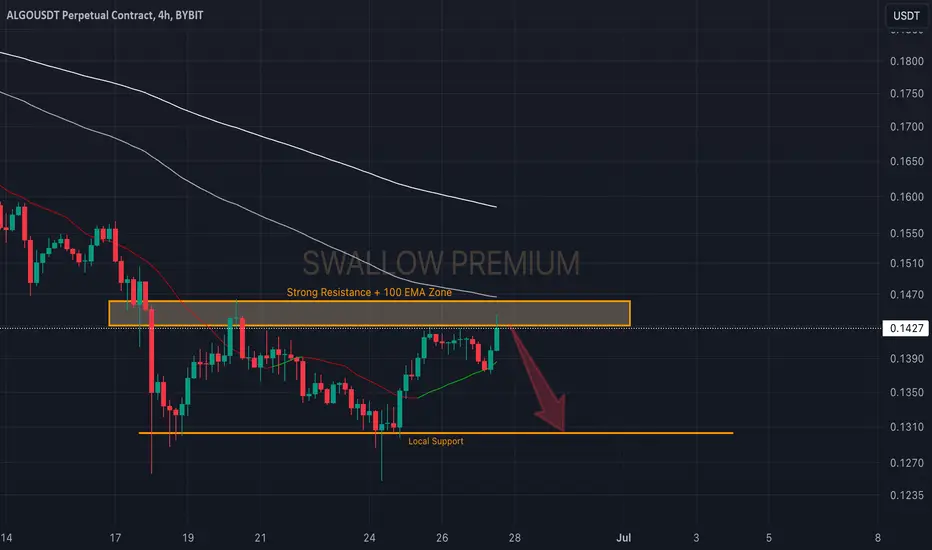
Algorand (ALGO): Looking For Rejection From Resistance!Algorand is looking sweet, trading just below the local resistance zone, trying to breakout from it.
We are looking for any signs of weakness to kick in near this zone in order to take a potential trade towards the support line in the lower zones!
Swallow Team
Check under your beds... those are BULLS!Buy the fear, alt season is near.
Bears are at the end of their ropes!
Bulls are coming back!
LONG like your life depended on it.

ALGO Price Analysis: Key Supply and Demand Zones (2024-2026)BINANCE:ALGOUSDT
The chart shows the price movements of Algorand (ALGO) against Tether (USDT) on a 3-day time frame. Here are some key points and features of the chart:
1. **Supply and Demand Zones**:
- There are marked supply zones around the $1.00 to $1.50 range, indicating areas where selling pressure may increase.
- A demand zone is highlighted around the $0.0820 to $0.1838 range, suggesting buying interest in this region.
2. **Key Price Levels**:
- Significant levels are marked at $0.3728, $0.1838, and $0.0820, with the current price at $0.1431.
- The highest marked level on the chart is $2.9900, indicating a potential upper resistance level.
3. **Volume Profile**:
- A volume profile on the right side of the chart shows the traded volume at different price levels. Higher volumes at certain price points suggest those levels may act as support or resistance.
4. **Breaks of Structure (BOS)** and **Change of Character (ChoCH)**:
- The chart indicates areas where the market structure has shifted, potentially signaling changes in trend.
5. **Price Action Analysis**:
- The historical price action shows peaks and troughs with specific points of interest (POI) marked.
6. **Current Trend**:
- The price appears to be in a downward trend, reaching a low around the $0.0820 mark before bouncing back to the current price of $0.1431.

ALGO/USDT MAY 2024It's been a while since our last chart update, but now is a great time to analyze some long-term patterns in altcoins. We still have a few spot trades open, and ALGO looks particularly promising with its potential for significant profits.
Currently, ALGO is showing an accumulation phase, which could lead to massive gains if it maintains the inverse head and shoulders pattern it's forming. The right shoulder is still in progress, indicating potential upward momentum.
Exit Targets:
First Target: $0.29 area
Second Target: $0.45 area
Keep an eye on the low of the right shoulder at $0.15, as this level would invalidate the pattern.
As always, ensure your money management strategies are in place. Happy trading!
