ALICE Looks Bearish (4H)The ALICE structure is bearish. It has been rejected from premium zones and a bearish internal CHoCH has also formed.
A move from the identified supply zone toward the demand zone is expected.
A daily candle close above the invalidation level would invalidate this analysis.
Do not enter the posit

ALICEUSDT UPDATE
ALICE/USDT Technical Setup
Pattern: Falling Wedge Breakout
Current Price: $0.494
Target Price: $1.20
Target % Gain: 170.08%
Technical Analysis: ALICE has broken out of a falling wedge on the 1D chart, showing early signs of reversal. The breakout is accompanied by a strong green candle, confir

ALICEUSDT 1D AnalysisALICE ~ 1D Analysis
#ALICE Currently it comes out of this declining zone. Maybe this support block you can consider to start buying back from here with a short -term target of at least 10%+.

We are witnessing the attack of the bulls on Alice's neighbor. In the medium term, and given the movement of Bitcoin, if there is no severe crash in the market, Alice can reach the specified range. However, this is what I think about and shared, so there is no reason for you to use it. I hope you do not come out of this market empty-handed.

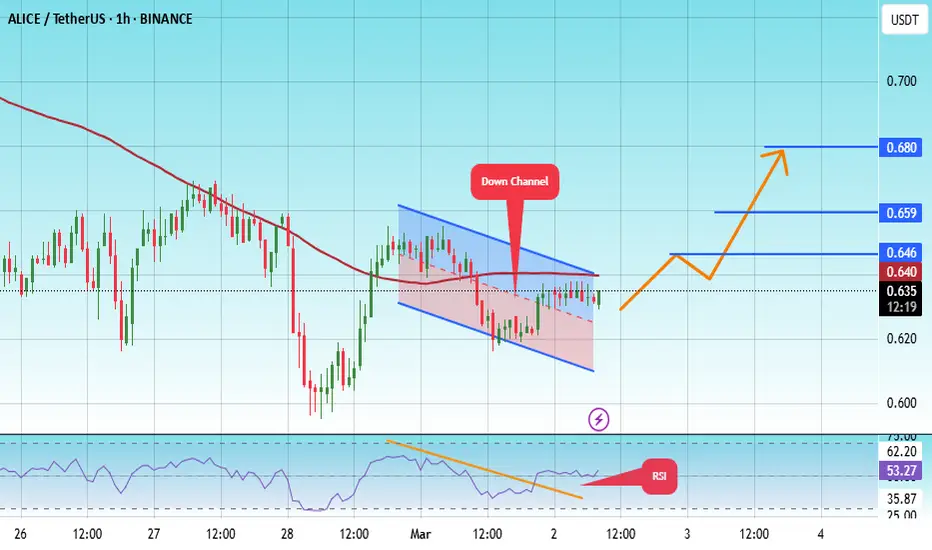
#ALICE/USDT#ALICE
The price is moving in a descending channel on the 1-hour frame and is adhering to it well and is heading to break it strongly upwards and retest it
We have a bounce from the lower limit of the descending channel, this support is at a price of 0.615
We have a downtrend on the RSI indicator
ALICEUSDT 5DALICE ~ 5D Analysis
#ALICE Test this support block. Buy from here if you still have a Conviction on this coin with a minimum target of 20%+.

ALICE UPDATEHow are you my friends?
I warned against falling to this level and below in the previous post you can see it on my page
Today we actually see the 0.86 level
Now we will see again a rise from these areas which are considered good as I told you last time about the fall to the accumulation areas
Th

ALICE AnalysisWe can see more decline but this is temporary
We can see more decline but the trend is still up and the targets are very big
But it is better to be aware of the entry points from the 0.96 area and any other decline you can strengthen by buying and maintain your buying positions without worry
The

#ALICE/USDT Ready to go higher#ALICE
The price is moving in a descending channel on the 1-hour frame and sticking to it well
We have a bounce from the lower limit of the descending channel, this support is at 1.08
We have a downtrend on the RSI indicator that is about to break, which supports the rise
We have a trend to stab

#ALICE (SPOT) entry ( 0.940- 1.140) T.(4.600) SL(0.849)BINANCE:ALICEUSDT
#ALICE / USDT
Entry ( 0.940- 1.140)
SL 1D close below 0.849
T1 1.450
T2 2.600
T3 3.400
T4 4.600
1 Extra Targets(optional) in chart, if you like to continue in the trade with making stoploss very high.
______________________________________________________________
Golden Advic

See all ideas
Summarizing what the indicators are suggesting.
Oscillators
Neutral
SellBuy
Strong sellStrong buy
Strong sellSellNeutralBuyStrong buy
Oscillators
Neutral
SellBuy
Strong sellStrong buy
Strong sellSellNeutralBuyStrong buy
Summary
Neutral
SellBuy
Strong sellStrong buy
Strong sellSellNeutralBuyStrong buy
Summary
Neutral
SellBuy
Strong sellStrong buy
Strong sellSellNeutralBuyStrong buy
Summary
Neutral
SellBuy
Strong sellStrong buy
Strong sellSellNeutralBuyStrong buy
Moving Averages
Neutral
SellBuy
Strong sellStrong buy
Strong sellSellNeutralBuyStrong buy
Moving Averages
Neutral
SellBuy
Strong sellStrong buy
Strong sellSellNeutralBuyStrong buy
Displays a symbol's price movements over previous years to identify recurring trends.