ALPHA is Ready To Fly (8H)ALPHA has encountered a key zone filled with strong buy orders.
The volume of these orders appears sufficient to potentially pump ALPHA to higher levels.
On the chart, we also have bullish confirmations, such as the formation of a CH (Change of Character) and the breakout of the trigger line.
As long as the green zone holds, ALPHA can move toward the target profit (TP) levels marked on the chart.
However, a daily candle closing below the invalidation level would invalidate this analysis.
Do not enter the position without capital management and stop setting
Comment if you have any questions
thank you
ALPHAUSDT trade ideas

ALPHA/USDT – Falling Wedge Breakout | Bullish Reversal in Play BINANCE:ALPHAUSDT has been trading within a classic falling wedge, a bullish reversal pattern, for several months. The wedge has been clearly defined by a series of lower highs and lower lows, gradually tightening into a breakout point.
The wedge’s measured move projects a potential 139% upside, aligning with key horizontal resistance levels and previous supply zones. A sustained rally could target the 0.05–0.067 zone in the medium term.
Key Levels to watch
Entry: ~0.02885 - 0.02650 (post-retest confirmation)
Target 1: 0.03801
Target 2: 0.05225
Final Target: 0.06731
Stop Loss: ~0.02254 (below wedge and key demand zone)
Consider trailing stops as price approaches key resistances.
Keep an eye on broader market sentiment — BTC/ETH retracements may affect follow-through.


ALPHA Structure Analysis - 50-day EMA breakoutYesterday, BINANCE:ALPHAUSDT cleanly broke and closed above the 50-day EMA, which it hadn't been able to reclaim since December 2024. It also retested the previous $0.042-$0.052 demand zone, which acted as resistance.
Check the weekly chart below for more context:
Key Levels
• $0.024-$0.034: Main demand zone, dating back to October 2020
• $0.042-$0.052: Previous demand zone and current resistance
• ~$0.070: Previous key S/R, currently reinforced by 1-year EMA, and potential resistance
• $0.115-$0.137: Main supply zone
Trigger
I am looking for a retest of the 50-day EMA (~0.035) as support for a long entry, with a clear invalidation below the recent $0.025 swing low, targeting the main supply zone with the other key levels outlined above as partial TP targets.

ALPHA Potential ReversalPrice rise was strongly rejected at the August 2024 low, which is now a key level.
Nevertheless, I am currently biased to the upside, with a presence of bullish RSI divergence in the daily chart.
In this scenario, the recent rise would be a leading diagonal (green 1-5).
The gray zone shown in the chart could offer the support needed for a new uptrend leg.

#ALPHA/USDT#ALPHA
The price is moving within a descending channel on the 1-hour frame, adhering well to it, and is heading for a strong breakout and retest.
We are seeing a bounce from the lower boundary of the descending channel, which is support at 0.0293.
We have a downtrend on the RSI indicator that is about to be broken and retested, supporting the upward trend.
We are looking for stability above the 100 moving average.
Entry price: 0.0300
First target: 0.0306
Second target: 0.0314
Third target: 0.0323

ALPHA Is Ready To Fly (8H)ALPHA has encountered a key zone filled with strong buy orders.
The volume of these orders appears sufficient to potentially pump ALPHA to higher levels.
On the chart, we also have bullish confirmations, such as the formation of a CH (Change of Character) and the breakout of the trigger line.
As long as the green zone holds, ALPHA can move toward the target profit (TP) levels marked on the chart.
However, a daily candle closing below the invalidation level would invalidate this analysis.
Do not enter the position without capital management and stop setting
Comment if you have any questions
thank you

ALPHAUSDT UPDATEALPHA Technical Setup
Pattern: Falling Wedge Breakout
Current Price: $0.0292
Target Price: $0.0667
Target % Gain: 145.78%
Technical Analysis: ALPHA has broken out of a falling wedge pattern on the 1D timeframe with a bullish candle and slight volume increase. Breakout looks valid with potential for strong upside momentum.
Time Frame: 1D
Risk Management Tip: Always use proper risk management.

ALPHAUSDT Downtrend Opportunity and Target ZoneALPHAUSDT has broken a key support level, signaling a potential strong downtrend. The focus is now on a possible pullback to the designated sell-off area, which presents an opportunity to enter short positions.
The primary target for this downtrend is the external demand zone marked on the chart. This zone is expected to act as the final destination for the current bearish movement, where significant buying pressure may emerge.
We should watch for the pullback to the sell-off area for optimal short entry, while keeping the external demand zone in sight as the ultimate price target.

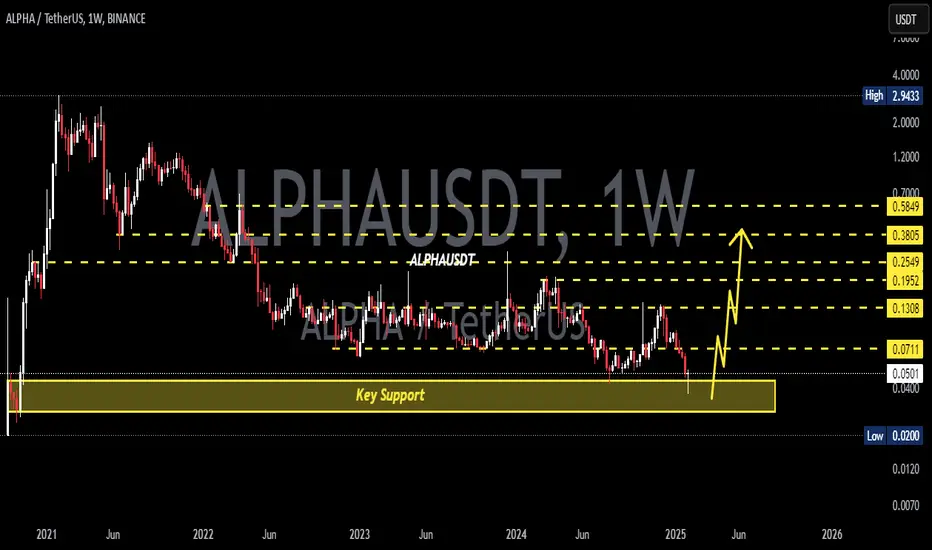
ALPHAUSDT 1WALPHA ~ 1W Analysis
#ALPHA This is the lowest support for now. Buy from here with a short -term target of at least 15%+. Trading is very high risk.

ALPHA - Beautiful Prediction SignalThose Levels played out beautifully.
I expected 2 % but look what happened. I changed my bias as market changed its sentiment.
💵💲 3x 7,5 %
That green level for long was front ran 2 times.
Retracement to Golden Pocket of the Fib and then BOOOOM ...🎯 👌
Here the original Signal/TA :https://www.tradingview.com/chart/ALPHAUSDT.P/RXYV0paK-ALPHA-Some-New-Levels/
Follow for more ideas/Signals. 💲
Look at my other ideas 😉
Just donate some of your profit to Animal rights and rescue or other charity :)✌️

ALPHA - Nice Signal/TA.Those Levels played out beautifully.
i expected 2 %
7,5 % 🎯 👌
after that clear rejection, should let it run ....
Retracement to Golden Pocket and then BOOOOM ...🎯 👌
Here the original Signal/TA :
Follow for more ideas/Signals. 💲
Look at my other ideas 😉
Just donate some of your profit to Animal rights and rescue or other charity :)✌️

ALPHA - Some New Levels There are some new levels which can give about 2% pure profit for a Short and Long.
🔴 Red Mark: expect a 2% short on it. A retest of lower yellow horizontal line on OBV could be a reference for red marked void line on price chart.
🟢 Green Mark: Here we could see a Swing Failure Pattern (SFP) which can be traded for 2% TP.
- The price drop was way too harsh and this could lead to a strong pullback, hence the 2% limit for TPs.
- FVG could has correlation to upper yellow horizontal line on OBV.
Look at my previous ALPHA Signal/TA which was really nice:https://www.tradingview.com/chart/ALPHAUSDT.P/MqsOEUcr-ALPHA-Coming-Short/
That void level gave us 2.6% Long 🎯 👌
Follow for more ideas/Signals. 💲
Look at my other ideas 😉
Just donate some of your profit to Animal rights and rescue or other charity :)✌️

ALPHA - Coming Short ?The TL is broken.
Wait for a retest on blue TL or even a short squeeze to 4h line (yellow mark) and short.
ALPHA is a little bit jumpy but not as that bad as XRP, CAKE or BAKE.
Look at AVWAP (yellow line) and OBV. They have much to say :)
Follow for more ideas/Signals. 💲
Look at my other ideas 😉
Just donate some of your profit to Animal rights and rescue or other charity :)✌️

Let's recover. Bullish for ALPHAHello Cryptosuppliers,
Alpha is since it took an all time high on 1 feb 2021 around $3 in a downtrend. You can expect a good recovery if it holds support.

ALPHA - There Was a Nice Signal/TA Given Days Ago.What a beautiful rejection and short. To the point.
👌 🎯 6.3 %
Levels are still valid.
TA was given here :
Follow for more ideas/Signals. 💲
Look at my other ideas 😉
Just donate some of your profit to Animal rights and rescue or other charity :)✌️

ALPHA - Nice Lines (for short?)it seems that there will be a nice short opportunity.
short the sht out of it, if it breaks lower TL.
upper TL must be analyzed extra if the price reaches there!
Follow for more ideas/Signals. 💲
Look at my other ideas 😉
Just donate some of your profit to Animal rights and rescue or other charity :)✌️


#ALPHA: Will the Bulls Take Over or Is Another Shakeout Coming?Yello, Paradisers! Is #ALPHAUSDT ready for a major breakout, or will weak hands get liquidated before the real move begins? Let’s dive into the latest setup of #Stella:
💎#ALPHA is trading within a falling wedge, a classic bullish reversal pattern. This setup often signals a strong breakout once the price breaks above the descending resistance. The probability of a bullish breakout is high due to the bullish divergence on the MACD.
💎The immediate resistance is at $0.0659. A decisive break and close above this level could trigger a bullish rally toward the next target at $0.0934. But the real game-changer will be the strong resistance zone around $0.12. If ALPHA pushes through that, you can expect fireworks.
💎The bullish divergence on the MACD further strengthens the bullish outlook. This indicates potential momentum building up for a reversal. However, don't rule out a possible liquidity grab—we might see the price dip towards the $0.0368 or even the $0.0245 strong support zone to shake out weak hands before the real move happens.
💎The $0.0368 support level is crucial. A breakdown below this could lead to a retest of the $0.0245 zone. If #ALPHAUSD falls below $0.0245, the bullish setup would be invalidated, and we might see a deeper correction towards $0.01. Stay vigilant and manage your risk carefully.
Stay focused, patient, and disciplined, Paradisers🥂
MyCryptoParadise
iFeel the success🌴

ALPHAUSDT 1WALPHA ~ 1W Analysis
#ALPHA If you still have a Conviction on this Coin, Maybe you can consider this support to start buying again, a minimum target of 20%+

ALPHA/USDTKey Level Zone: 0.07800 - 0.07850
HMT v4.1 detected. The setup looks promising, supported by a previous upward/downward trend with increasing volume and momentum, presenting an excellent reward-to-risk opportunity.
HMT (High Momentum Trending):
HMT is based on trend, momentum, volume, and market structure across multiple timeframes. It highlights setups with strong potential for upward movement and higher rewards.
Whenever I spot a signal for my own trading, I’ll share it. Please note that conducting a comprehensive analysis on a single timeframe chart can be quite challenging and sometimes confusing. I appreciate your understanding of the effort involved.
Important Note :
Role of Key Levels:
- These zones are critical for analyzing price trends. If the key level zone holds, the price may continue trending in the expected direction. However, momentum may increase or decrease based on subsequent patterns.
- Breakouts: If the key level zone breaks, it signals a stop-out. For reversal traders, this presents an opportunity to consider switching direction, as the price often retests these zones, which may act as strong support-turned-resistance (or vice versa).
My Trading Rules
Risk Management
- Maximum risk per trade: 2.5%.
- Leverage: 5x.
Exit Strategy
Profit-Taking:
- Sell at least 70% on the 3rd wave up (LTF Wave 5).
- Typically, sell 50% during a high-volume spike.
- Adjust stop-loss to breakeven once the trade achieves a 1.5:1 reward-to-risk ratio.
- If the market shows signs of losing momentum or divergence, ill will exit at breakeven.
The market is highly dynamic and constantly changing. HMT signals and target profit (TP) levels are based on the current price and movement, but market conditions can shift instantly, so it is crucial to remain adaptable and follow the market's movement.
If you find this signal/analysis meaningful, kindly like and share it.
Thank you for your support~
Sharing this with love!
HMT v2.0:
- Major update to the Momentum indicator
- Reduced false signals from inaccurate momentum detection
- New screener with improved accuracy and fewer signals
HMT v3.0:
- Added liquidity factor to enhance trend continuation
- Improved potential for momentum-based plays
- Increased winning probability by reducing entries during peaks
HMT v3.1:
- Enhanced entry confirmation for improved reward-to-risk ratios
HMT v4.0:
- Incorporated buying and selling pressure in lower timeframes to enhance the probability of trending moves while optimizing entry timing and scaling
HMT v4.1:
- Enhanced take-profit (TP) target by incorporating market structure analysis

LONG entry for Alpha At this moment, it looks like Alpha will turn to the upside and create a great opportunity to make more than 50% profit.
