$ALT Breaks 136-Day Resistance — Big Rally Loading?#ALT has officially broken above the 136-day-long resistance.
Price is now consolidating above the breakout zone, showing strength.
If momentum continues, a major rally could be ahead.
Watching closely for confirmation of the next move.
NASDAQ:ALT BINANCE:ALTUSDT

ALTUSDT 1D AnalysisALT ~ 1D Analysis
#ALT This trade is very risky NASDAQ:ALT Trying to penetrate this resistant line, Buy if successfully penetrate this resistant line with a large volume to avoid false breakout.

Turn off the fear and thinkLook closely: on the left is ALTLAYER, essentially a gem of the current cycle; on the right is HARMONY, a gem of the previous cycle. What unites them? They’re united by a 96% dump. But what happened next? Harmony, from the COVID wick, did a 300x. Now, let’s think: if we cut that 300x down to 100x, i

ALT looks bearish for mid-term (1D)ALT appears to be in a large-degree bearish wave C. If it reaches the red zone, we can look for a sell/short position targeting lower levels.
The minimum time required for wave C to complete is marked by the vertical line on the chart. Keep in mind that this is the minimum duration—if the wave exte

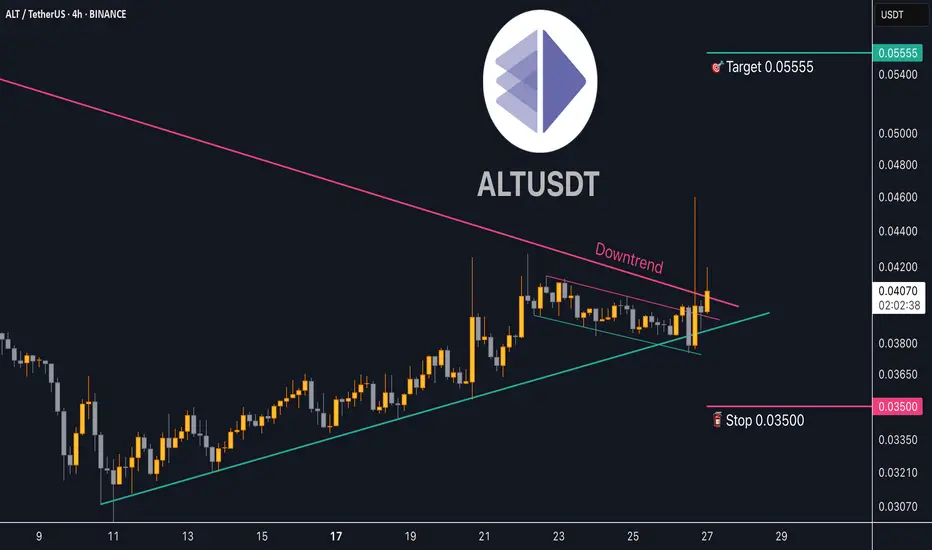
Trading opportunity for Altlayer ALTUSDTBased on technical factors there is a Buy position in :
📊 ALTUSDT
🔵 Buy Now
🪫Stop loss 0.03500
🔋Target 0.05555
📏 R/R 2,4
💸RISK : 1%
We hope it is profitable for you ❤️
Please support our activity with your likes👍 and comments📝
ALT ( SPOT - INVEST )BINANCE:ALTUSDT
ALT / USDT
1D time frame
analysis tools
____________
SMC
FVG
Trend lines
Fibonacci
Support & resistance
MACD Cross
EMA Cross
______________________________________________________________
Golden Advices.
********************
* Please calculate your losses before any entry.
* Do

ALT- Trading idea.
Altlayer - emerges as a decentralized protocol designed to revolutionize the blockchain landscape by simplifying the launch of native and restaked rollups. These rollups, which can be based on optimistic or zk-rollup stacks, benefit from enhanced security, decentralization, and interoperability

$ALTUSDTKey Observations
Price Action & Trend:
Recent price action shows consolidation between 0.03952 (current level) and 0.04372, indicating potential up side.
Critical Support & Resistance Levels:
Major resistance levels: 0.08000 and 0.11477 (previous breakdown zones).
Market Sentiment:
Consolidat

ALTUSDT bullish outlookAltlayer looks promising after the retest on the descending trendline.
Breakout will be confirmed after 0.17.
Targets -> 0.29 and 0.36
Invalidation -> below 0.11

ALT/USD – Key Technical UpdateRecent Price Action:
ALT has seen a significant decline, with bulls looking for support amid intensified bearish pressure. The recent drop highlights vulnerability, but key support levels below could provide a foundation for recovery.
Key Levels to Watch:
Support Levels:
$0.08500: Immediate suppo

See all ideas
Summarizing what the indicators are suggesting.
Oscillators
Neutral
SellBuy
Strong sellStrong buy
Strong sellSellNeutralBuyStrong buy
Oscillators
Neutral
SellBuy
Strong sellStrong buy
Strong sellSellNeutralBuyStrong buy
Summary
Neutral
SellBuy
Strong sellStrong buy
Strong sellSellNeutralBuyStrong buy
Summary
Neutral
SellBuy
Strong sellStrong buy
Strong sellSellNeutralBuyStrong buy
Summary
Neutral
SellBuy
Strong sellStrong buy
Strong sellSellNeutralBuyStrong buy
Moving Averages
Neutral
SellBuy
Strong sellStrong buy
Strong sellSellNeutralBuyStrong buy
Moving Averages
Neutral
SellBuy
Strong sellStrong buy
Strong sellSellNeutralBuyStrong buy
Displays a symbol's price movements over previous years to identify recurring trends.