Anticipating a breakout to the upside in gold via IAUiShares Gold Trust (IAU) is a passively managed ETF that seeks to match the movement of the price of gold. It provides an investment vehicle for gold by backing shares in the ETF with gold bars held in trust.
After a steady recovery from the trough of March 20th, a trend reversal starting on Aug 5th manifested as a descending triangle (or perhaps a large pennant) that broke out to the downside after 7 weeks.
However, this downside breakout was rebuffed by buyers, perhaps due to the economic and political uncertainty surrounding the pandemic as well as the US presidential election, which at the time of the turn around was 40 days away.
The ETF saw a 4% increase in value over two weeks and has settled into an ascending pennant where resistance is being tested and the lows are higher.
I anticipate a breakout to the upside if the bottom ascending line holds, especially as we near the US presidential election (Nov 3rd). This breakout may occur in the days leading up to the election, or perhaps right afterwards.
Let me know what you think in the comments!
******
These ideas are presented as a topic for discussion and do not represent a recommendation to trade a security.
******
IAU trade ideas

GOLD keep breaking all time highHHHL + Y1<Y2
X2 is around the same length as X1 now. It should make a reversal up soon.
It is also a good sign that the angle of X2 is a lot flatter, rather than steep.
got power up if W&R success.

Long Put IAU May 15 '20 $14 Put @ $0.15Volatile market. GLD too expensive, high premium. IAU excellent alternative.
Shorting Gold for IAU $140 Strike at $0.15. GLD/Futures approximately high 140's.

Gold Testing Short-Term Support, Hedge Against FOMOWhile the rest of the market ran bullish at the end of the previous week, Gold dipped negative, crossing below the 30-day and 50-day moving averages. Prices are currently trading horizontally in the short term with $16 being a support level that has not been broken, despite several tests since mid April.
Low MACD amplitude swings also correlate to a near-term horizontal move as opposed to any breakthroughs, contrary to many other bullish equities. Further, the volume at the latter half of last week did not see a significantly large increase, also contrary to the FOMO activities of the rest of the market. These realities may correlate to investors of Gold being more interested in a longer term safe haven as opposed to short term swing trading.
Go long at the current support level either as a hedge against a potential market correction or purchase medium term call options as a bet on a steady average rise in Gold prices.

Gold Potentially Retracing, Prepare to Buy LongTechnicals:
--------------
$16.03 and $16.61 are approximately the short term support and resistance levels, forming a channel where the price is being pulled horizontally. This area also appears to be a price consolidation point around $16.38 following an April 20th high volume day.
Fundamentals:
------------------
Gold is trending up. This momentum is due both to the medium term high VIX volatility and an overall pattern of prices rising after a market correction/downturn event. This correlation of gold to volatility and market correction follows a similar pattern from 2006 to 2011.
Strategy:
-----------
Longer term call options are ideal for the current market. Purchase 3-month long call options if IAU breaks through $16.60 or if it retraces to $16.03.


IAU tiene un ratio W/L de .56 y en posible zona de resistencia.Su tendencia a corto y mediano plazo es alcista pero el ratio no está muy jugoso para tomar posición.
El único indicador con señal visible es a primera vista 3MA en velas diarias.


IAU to stay lowI identified that the IAU possible to stay low in the mean time as stock market as at the brink of possible making an all-time high. Therefore, the trend is moving down.
Entry: 14.37


Gold ETF, similar to GOLD price. We can see a very bullish sign.Gold ETF, similar to GOLD price. We can see a very bullish sign.

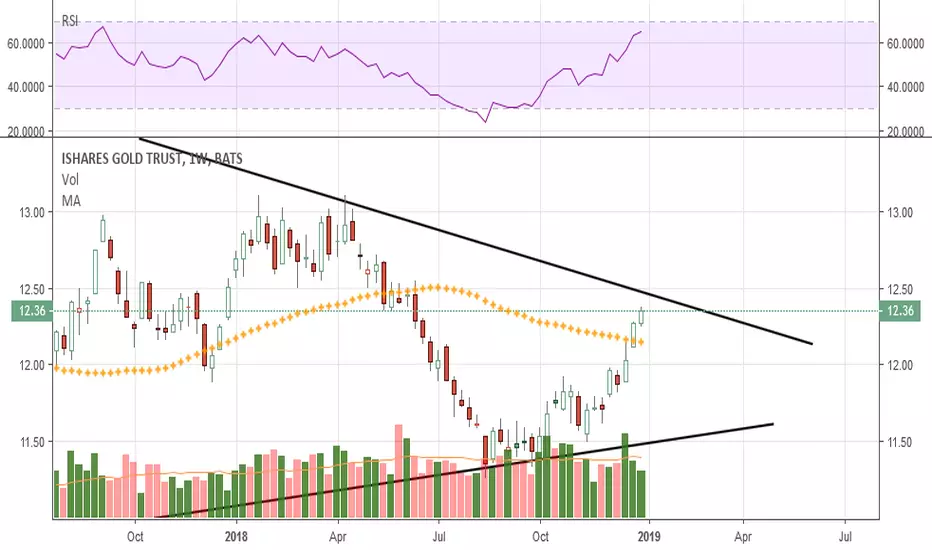
Monthly ishares Gold Trust. Interesting wedge! Went long today, small position for long termer; I feel Gold will make a comeback 2019

Gold Breaking OutGLD and AMEX:IAU have both had very good runs recently.
They both originally broke out of their wedges however, they both ended up not maintaining their trend line.
The main differences I want to point out between the two is that GLD has not gone above the bottom trend line while
AMEX:IAU has.
AMEX:IAU also has increasing volume but GLD has remained somewhat flat on volume.
This doesn't mean that gold is not being bought but rather understanding how different ETF inflows and outflows can change the performance even though the underlying is the same. see here for a little more details
* Note: Technically IAU is 1/100 the price of gold and GLD is 1/10 the price of gold. However this should not impact the analysis since it's the same as buying 1/100 a chunk of a gold bar or 1/10 a chunk of a gold bar. Both values should remain consistent with their underlying which is 1 bar of gold.
* This information is not a recommendation to buy or sell. It is to be used for educational purposes only.

GoldAfter an 8 week sideways range, perhaps could see an upward breakout: around the 11.65 - 11.75 area >> but definitely would need above average volume to confirm this. And also, should move above EMA50. Lets see how it goes :)

IAU gold ETF reversal ?Weekly chart looks promising. The MA of 50 and 200 weeks have crossed for first time since 2005 (beginning of my chart) and they are heading away from each other a little less than 30 degrees. Could turn into a failed reversal, but something to keep an eye on. If this an upward trend starting it could be a steep climb up the chart. Who knows with precious metals and the daily's don't look as promising. Just an interesting weekly chart observation. Good luck everyone. Thoughts ?


Gold as potential hedge against US depreciation and bear markeCurrently considering IAU as a hedge against potential downturns in the $ and/or in US markets. The trade isn't strictly technical, though we could say the price looks slightly over extended at the moment, so I'd wait until support is hit and an uptrend emerges again. Trade thesis comes from the increasingly likely possibility of an asset bubble deflation with insuing stagflation following a rate hike. Dollar depreciation would create a vicious cycle where foregneirs are unwilling to buy US debt given exchange rate risk, causing the bond market to collapse. Technical analysis is only marginally affecting decisions related to this trade.

It looks like gold is set for another runIAU just bounced off the bottom of it's trading range. The strength of the $ may limit this run.

GO LONG GLD/IAUExcellent retest of prior break out! First target $12.90. Accumulation phase. Will add on deep weakness if able.

