IEMG - another powerful move to the top of the channel??This ETF has been moving. Looks like it has room to run.
IEMG trade ideas

Emerging marketsThe National Stock Exchange of India has experienced the best year as investors ripped big as their stock market pushed higher, outperforming major global indices. Other emerging markets have been on investors' radar as they look for other markets to invest in.
The iShares Emerging Market ETF experienced an aggressive sell-off that is on its way to recovery to reflect the optimism investors have in emerging markets. The disconnect is a possible discount to ride this wave of optimism in emerging markets.

IEMG Emerging markets Bull flagThere is a bull flag forming on IEMG. I am waiting for a test of the 0.382 fib which also lines up with previous support.

IEMG ETF Retest of level 48.89Idea:
SL < 48.81
BUY < 49.57
Fundamental:
- Pro: NAV is big enough
- Pro: IShares ETF is liquid enough

IEMG Emerging Mkt: bottom is in; see TP for waves 3 & 5IEMG made a bulltrap with a long hammer in this monthly chart. RSI oversold.
It went back inside the pitchfork upchannel.Wave 1 of 3 has bottomed out.
The target price for wave 3 is 90 (FIBO Ext), a 55% profit from the 58 price.
Final wave 5 target projected at 1.618 FIBO is around 111.
Not trading advice

Emerging Mkt ETF: BULLFLAG will make a 55% run from current 58IEMG has very high probability of reversing due to the recent formation of a diamond pattern.
Some more downside move to the base of pitchfork is still possible but unlikely due to the BULLFLAG formation. Also smart money has already been accumulating with increasing volume during this flag consolidation. Macd, Stochastics & RSI turning up.
Either Wave 5 starts or more probable is this current wave 3 shall extend after this flag consolidation with a FIB EXT target price of 90, a 55% run.
Not trading advice

Trends in select Emerging Markets (& smaller markets) via ETFsRecent trends in select Emerging Markets (and some smaller markets) viewed by their ETFs, for the countries: Brazil EWZ , Mexico EWW , New Zealand ENZL , South Korea EWY , China MCHI , India INDA - also vs. the emerging markets ETF IEMG , and the NASDAQ IXIC index.


iShares Core MSCI Emerging Markets ETFCost: $ 52.27
Annual trading range: $ 35.66-55.45;
Dividend Yield: 3.51%;
Wealth Management Cost: 0.13% per year (i.e. $ 13 for every $ 10,000).
iShares Core MSCI Emerging Markets (NYSE: EEM) ETF (NYSE: IEMG) invests in 2,476 large, medium and small companies. The five largest sectors are represented by “finance”, “information technology”, “consumer goods”, “telecoms” and “material suppliers”. Representatives of these sectors make up about 70% of the fund's assets.
IEMG is looking for investment opportunities that match the price and return metrics of the MSCI Emerging Markets Investable Market Index. This benchmark reflects the dynamics of large, medium and small companies in emerging markets. The fund is currently focused on Asian economies.
The fund's ten largest holdings account for roughly 25% of total net assets, which are close to $ 52 billion. The top 5 IEMG companies are represented by Alibaba, Tencent Holdings, Taiwan Semiconductor Manufacturing, Samsung Electronics (OTC: SSNLF) and Meituan Dianping (OTC: MPNGF).
Since the beginning of the year, IEMG is down 2.8%, but it bounced off March lows by more than 45%.
Long-term investors might consider buying this ETF on a pullback to $ 50 or even $ 45.

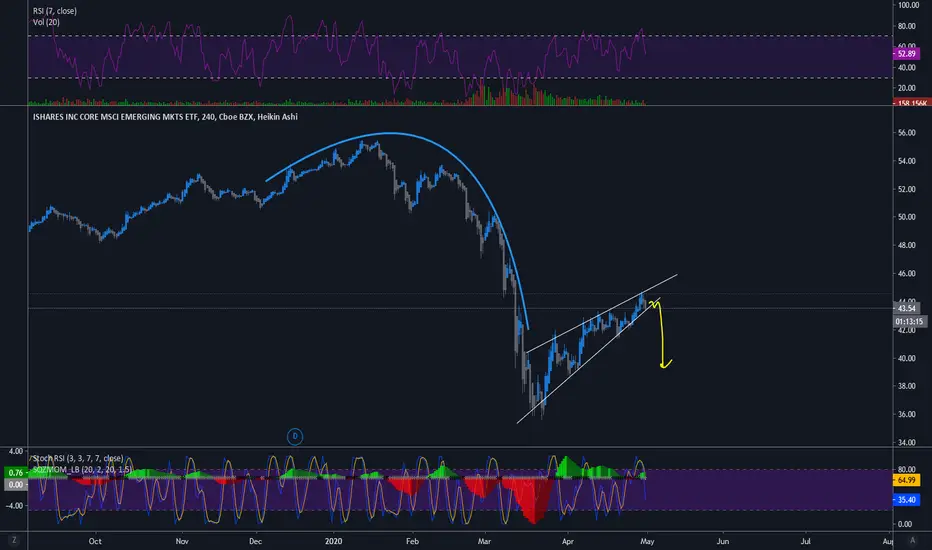
IEMG Ascending WedgeForming a wedge since the local bottom in March. I would expect it to break down further.

Looking into IEMG ETF, why it performs so poorly?Why it performs so poorly compared to its top 10 components?

Long this if chikou cross the Weekly cloudIt's been this december 2016 we haven't crossed the Weekly Cloud.
Last time we crossed it we had a year bull run.
For more conservative play, wait the break and retest of 55 horizontal resistance and waiting the chikou confirmation.

IEMG stock price forecast timing analysis. 13-JunStock investing strategies by pretiming
IEMG
Investing position about Supply-Demand(S&D) strength: Rising section of high profit & low risk
Supply-Demand(S&D) strength linkage Trend Analysis: In the midst of an adjustment trend of downward direction box pattern stock price flow marked by limited rises and downward fluctuations.
Today's Supply-Demand(S&D) strength Flow: Supply-Demand(S&D) strength flow appropriate to the current trend.
Possibility of change in forecast timing: Forecast timing has low variability conditions. because they maintain the proper flow of supply - demand in the current trend.
D+1 Candlestick Color forecast: GREEN Candlestick
D+1 Range forecast: 0.1% (HIGH) ~ -0.4% (LOW)
AVG in case of rising: 0.9% (HIGH) ~ -0.1% (LOW)
AVG in case of falling: 0.2% (HIGH) ~ -0.8% (LOW)
Stock Price Forecast Timing Criteria: Stock price forecast timing is analyzed based on pretiming algorithm of Supply-Demand(S&D) strength.
Read more a detailed Forecast Analysis Reports that candlestick shape and %change, S&D strength flow in the future 7 days.
www.pretiming.com

Symmetric Triangle in IEMG- IEMG
- Symmetric Triangle
- Higher minimums and Lower maximums
- It doesn't matter the trend in this pattern
- Non directional
- Short position after breaking the lower band

Emerging Market ETFThis ETF looks to continue to boom especially after the China and US have optimistic trade talks. Mainly China companies inside this ETF.


