SPY - dump or bull market is back?hi traders,
Some months ago, we shared the idea where we explained that SPX will experience a correction:
The targets were reached, and next we saw a decent bounce, which is very well visible on the monthly candle.
Today, I see a lot of excitement about the monthly close, and many people call for a new all-time high soon.
I want to bring to your attention the monthly close in 2000.
It looks very similar to what we got yesterday.
A long, lower-shadow wick resulted in a bearish imbalance characterised by an excess of sellers, exerting downward pressure.
I still can see SPY/SPX retesting 570-580 levels, but it doesn't change the fact that lower levels may be tested in the next few weeks/months.
We got a bearish cross on the monthly time frame, which is not a joke.
If bears take control, I expect SPY to visit 460~ levels and later even lower: 410-408.
Long story short:
1. Short-term bounce may continue.
2. Mid-term - bears will take control, and we will see a bigger correction.
Do you agree? Share your opinion in the comments section
SPY trade ideas

SP500 ETF: Fibonacci MappingAs you may know, Williams Fractals indicator identifies potential reversal points by marking a high (or low) surrounded by two lower highs (or higher lows) on each side, forming a five-bar pattern that signals possible turning points in price. Unfortunately, the simplicity of such indicator provides just tiny perspective, undermining broad implication of the concept.
Before I begin diving into processing geometric narrative of emerging price via fibonacci channels, I want to explain how I interpret fractals.
When I use the term "fractal", I'm not just talking about the points alone. Market continuously corrects itself, so analyzing it by price alone can bring more confusion than help. The object of observation shouldn't be limited to quantifying just by a single property. Chaos by default requires awareness from both price and time aspects. The easiest way to root it in my vision was through realization that price is a function of trading time intervals. Its activity can be described as cyclical progression, as if it is wired by multiple "springs" of different tensions.
Classic TA patterns known to literally anyone are great for anticipating a move in surface level forecasts. Since my line of work focuses on prediction over forecasts, it requires deeper structural awareness behind complex oscillations.
Let's observe the way selloff scales from ATH and how it impacts fractal hierarchy.
The first corrective bullish wave can be explained as a reaction to initial impulsive bearish wave. The bigger scale drop from ATH to a lower point explains why the corrective bullish wave looks the way it is. And so on:
In fractals, scaling laws describe how key properties change with size, typically following power-law relationships that reflect the structure’s self-similarity, where a characteristic scales with the size raised to an exponent.
To build a probabilistic model, we must keep in mind how the smaller bits make up bigger scale picture. ATH, established bottom and angle of progression defined by pullback highs, all those points have structural weight. Since psychology of masses that shapes price dynamics is governed by mathematical sequences found in nature, it's fair to use Fibonacci Channels to map the geometry of interconnectedness.
Similarly, all of those points can be referred by another fibonacci channel with opposite direction.
From my perspective, traditional TA patterns reflect just phases of cycle, this is why I unify those fragments into broader scalable shapes. This distinctive branch of Fractal Analysis allows to track systematic aspects of market behavior and explains how a pattern replicates itself in rhythmic continuity.

SPY Time to come down.SPY time to take a break but don't expect much from the 4hrs and 1hr pov. probable 555.00 and in the worse case scenario 523.00. We'll see once it gets there and most important "how it gets there".
It has strong res at 575.00

SPY to pulback to 544Looking for SPY to pullback to 544.
544 is a very strong support, also the 38.2% fib. If it breaks this level, then it expect a rapid acceleration to 530 and 515.

Beyond The Plan Your Trade Videos - Trading Algos/ConfirmationMany of you follow my morning Plan Your Trade videos - and I thank you for your loyalty and dedication.
The Plan Your Trade videos are specifically deigned to highlight my SPY/GOLD Cycle Patterns and, over the course of the past 9+ months, I've started trying to teach all of you Fibonacci Price Theory and the concept of the Excess Phase Peak pattern (and Cradle Pattern).
My goal is to teach you to learn to understand price structures, setups, and actions as a way to try to advance your technical analysis/trading skills.
There are so many others out there trying to teach you to use indicators and other types of analysis to try to identify trading opportunities/setups. Some work, some don't.
Technical analysis using Indicators, Elliot Wave, or other forms of predictive analysis/AI are only about 50-75% accurate at best (IMO). Nothing is 100% perfect.
After 35+ years of trying to unlock the secrets of price action to devise a 100% accurate trading system, the closest I have come is a system that generates about 65-75% accuracy - but still manages to take some losses.
I do believe I can find that 100% accurate system (hopefully before I die). But the reality is it is almost impossible to accurately predict price movement 10-20+ days in advance with any degree of accuracy.
Over the past few weeks/months, we've seen the SPY/QQQ move through various stages/phases.
Over the past 4+ weeks I've been warning of the broad-consolidation phase that is currently setup on the SPY/QQQ. I believe this huge consolidation range is very dangerous for traders and that extreme volatility will create lots of risk/opportunities for those capable of trading within this range.
But, at the same time, failing to take advantage of tools to help traders hedge, daytrade, or otherwise balance allocation/risk levels is something I really don't talk about much.
I like to say "I do the research - you make all the trading decisions".
This video highlights some of my advanced algos and how I use them, in conjunction with the EPP and other patterns, to try to gauge market opportunities vs. risks.
Trust me. I've learned not to GO BIG on trades over the past 20+ years because I've blown up a few accounts trying to get greedy.
Right now, I focus on trying to be on the right side of trends (if possible) and to balance my portfolio in 10-20% increments.
For example, if I believe GOLD is going to move higher, I may start out with a 5-10% allocation into GLD or UGL (start small). If that trade works and Gold starts to make a move higher, I may try to add a bit more to that initial trade. If it doesn't work out, I may try to add a little bit more at a better entry price level - but I focus on not letting that trade occupy more than 15-20% of my total portfolio.
That way, if I take a loss on the trade, it is a small loss compared to the overall account capital.
If I take a 50% loss on a 20% allocation - that is only a 10% loss on the TOTAL ACCOUNT SIZE.
Get it?
So, the reason for this video is to show you how you can still use technical strategies/indicators to try to confirm you intraday trading and swing trading opportunities. I like to use the SuperTrend strategy on charts to identify general trending.
I'm urging you to consider my Plan Your Trade videos as "one component" of your skillset. You need to use your own skills/techniques/analysis to try to manage risks vs. opportunities as you continue to trade.
I highlight some of my algos because they become another "component" of my analysis when I'm trading. If I don't see broad market capitulation related to Daily trending - then I try to stay VERY CAUTIOUS. If I do see some capitulation within my algos suggesting the markets are starting to trend upward or downward, then I may try to take advantage of that opportunity.
Ideally, the process of trading is to use everything you like and can rely on to help confirm you decision-making. Then, fall back to a efficient trade allocation process that attempts to limit your risk level.
The biggest mistake I see people make is to go ALL IN or TOO HEAVY into a trade thinking they can't lose. Yes, you can lose. So can I.
That's why it is important to contain risks and protect capital at all times.
I'll try to create another video showing you how I use the SuperTrend indicator to help confirm some of my intraday analysis for trades.
Get Some.
#trading #research #investing #tradingalgos #tradingsignals #cycles #fibonacci #elliotwave #modelingsystems #stocks #bitcoin #btcusd #cryptos #spy #gold #nq #investing #trading #spytrading #spymarket #tradingmarket #stockmarket #silver

Elliott Wave top on SPY’s monthly chartTechnical Analysis:
Wave Structure (Elliott Wave)
• Wave 1–2: Early 2020 correction (COVID crash) marked a clear wave 2 bottom.
• Wave 3: Strong impulsive rally from mid-2020 to late 2021 — massive liquidity-driven.
• Wave 4: 2022–2023 pullback — clean retracement to ~0.382 Fib, validating wave structure.
• Wave 5: Parabolic final rally peaking around $550–560 (currently topping or topping out).
Bearish Signals:
• Volume divergence — Price up, but monthly volume flat-to-declining. Distribution behavior.
• Completed 5-wave structure — Indicates exhaustion.
• (A)-(B)-(C) Correction Starting: The projection shows:
• Wave A targeting ~$420–440.
• Wave B dead cat bounce.
• Wave C projecting a deeper correction into $300–340 zone (around 0.5 to 0.618 retracement).
Fibonacci Confluence Zones:
• 0.382 = ~$450
• 0.5 = ~$390
• 0.618 = ~$340
These zones will act as major liquidity pools for institutional entries or macro rebalancing.
Macro Headwinds Fuel the Narrative:
• Sticky inflation
• Rising interest payments on U.S. debt
• Deteriorating liquidity (QT regime)
• Over-leveraged consumer and commercial debt sectors

$SPY Its time according to my chart.. Lower high is the trigger I posted two charts for reference to the current situation. With a historic rally right into resistance and a fractal analog that matches, I have no choice but to remain bearish. These are my studies. Sometimes Impatience leads to things like Impulsive Entries and Exits, Revenge Trading, and at times, even Blown Accounts. Times like those should be followed by a regroup and a reset.
The 9 Count Sell Signal Triggered with a Reset is on Technical Inidators for a move lower. I do believe we are going to consolidate for several days but nothing further than the second week of May. Today Bulls got extremely bullish and still were not able to hold the highs into the close. The test of the 200 day SMA was rejected and several days near these leveles whether above or below, would prove the downside move more possible. The monthly on SPX is my biggest indicator, personally. If it follows the pattern I'm following then after a test of the 10WMA, we will roll back over on the next 10 day candle. The market ran through a death cross without stopping, which if anyone were to study for several minutes, they would be able to see any first attempt at a death cross to the upsde is almost immediately met with a selloff back to the lows of the breakout move. Good luck everybody.

$SPY Short Swing, vwap+supply+resistanceBackground. Easy confluence trade. We had the largest and fastest rally in stock history from 2022 to now. Everyone who loaded up at $380-430 is ready to take some profits. After the tariff announcements, we sold off hard through a bunch of levels and trendlines down to the bottom of the longer term uptrend.
Current situation. We have retraced back up to the first major supply area, where everyone who bought the dip back in march went long. They've been underwater and are ready to sell for scratch. This will drive the price back down. Maybe the end of a long term uptrend. Maybe just leg 2 of the tariff drop, back down to the trendline. I can't know that.
Delta. If you look at the volume footprint chart, there has been a huge negative delta this whole rally. Prices are going up but the larger players are selling into it. Essentially, the last 2 weeks have been driven up by main street, while wall street unloads. Once there are enough bagholders, the floor can fall out. Here's the weekly delta.
Trading Approach. This is a good point to initiate the start of a long term short position. Like, buying puts 1-2 years out with a $450 target, a gap that's never been filled. I think it's also a good swing entry but with closer targets. On the more pessimistic attitude, after the tariffs, the world started the process of dethroning America as leader of the free world. There's a lot of gravity pulling down to $250 and if the world fully turns on the US, that's where we're heading.

The Daily 200 MA Is The KeyRegarding how price action will play out over these next couple months, there's 3 likely scenarios, and it involves how price will interaction with the daily 200 MA:
BLUE: Price makes a convincing break above the daily 200 MA, retests it, and then surges onward, continuing the long-term bullish trend.
PURPLE: Price falsely breaks above the daily 200 MA and tests the 600 psychological level, rejects it, and falls back below the daily 200 MA and retests it, thus creating a H&S pattern and confirming the continuation of the bearish trend.
RED: Price rejects the daily 200 MA, and continues the bearish trend, ultimately forming a new low.

SPY Holding the Channel – Can It Bounce or Fade Today?Market Summary
SPY is currently trading around $563, showing early weakness after stalling below key resistance at 566–567 last week. Futures were flat overnight with mixed macro sentiment and low volatility. We're starting today near the lower trendline of the rising channel visible on the 15-minute chart.
Technical Structure
* Trend: Price is still holding the lower boundary of the upward channel from May 1–2.
* Support: ORL at 564.29 and lower trendline ~563.20–563.40.
* Resistance: ORH at 565.47, PMH at 565.95, and GEX resistance at 567.
* Indicators:
* MACD: Flattening with bearish cross on shorter timeframes.
* Stoch RSI: Reset to lower range, watching for potential curl up.
Options & Gamma Insight (GEX)
* Current Price: $563
* PUT Pressure Dominant: GEX sentiment is 🔴🔴🔴 Bearish, with:
* PUT$ flow = 115.6% (significantly overweighted)
* IVR 26.1, IVx avg 20.4 = Still room to expand in volatility.
* Key Gamma Levels:
* Resistance Walls:
* 567 → 2nd CALL Wall (major resistance)
* 568–570 → CALL resistance zone
* Support Zones:
* 562–561 → Heavy GEX support
* 560 → Highest negative net GEX = strong PUT wall
Potential Scenarios for Today
🟢 Bullish Case:
* Price reclaims ORH 565.47 and breaks above 566, triggering momentum to test 567.
* If momentum continues, squeeze toward 568 or even 570 is possible, but less likely unless volume spikes.
🔴 Bearish Case:
* Break below 562.68 Ask, triggering fast move to 561.70 and possibly flush into 560 PUT wall.
* Below 560 opens the door to 557 or even 554–555 if panic selling or negative macro.
Actionable Levels
* Long above: 565.50 with target 566.80–567 | Stop < 563.80
* Short below: 562.80 with target 561 → 560 zone | Stop > 564.50
* Scalp Range Zone: Between 563.50–565.50 = chop risk
Final Take
SPY is pinned between heavy PUT support at 560 and CALL resistance at 567. With PUTs outweighing CALLs, a flush toward 561–560 could be favored unless bulls reclaim 566+. Watch for sharp directional trigger around 10:00–10:30 AM ET.
📌 This preview is for educational purposes only. Always use proper risk management and confirm with your own system before trading.

Stock Market Forecast | TSLA NVDA AAPL AMZN META MSFTStock Market Forecast | CME_MINI:NQ1! CME_MINI:ES1! QQQ SPY SP:SPX
Mag 7 Forecast TSLA NASDAQ:NVDA AAPL AMZN META MSFT


SPY/QQQ Plan Your Trade Update For 4-30 : Moving Into FlaggingThis quick update video should help you understand how my May 2-5 Major Bottom pattern could represent a move into FLAGGING within an inverted EPP pattern.
If my research is correct, the next move for the market will be a moderate downward price trend that will represent the FLAGGING portion of the inverted EPP pattern.
You've all see how bullish EPP patterns play out over the past 3 to 5+ months. Now we get to see how this recent SPY low near 480 turns into an inverted EPP pattern. This is basically the same pattern - but forming in an inverted mode.
As we transition through this inverted EPP pattern, what I'm looking for is a breakdown move to create the new FLAGGING formation. This move aligns perfectly with my May 2-5 Major Bottom pattern and could be a perfect setup for the attempted "breaking of the Flag High" in late May 2025.
I'm watching Gold and Silver stay relatively strong today. So I'm seeing today's market move as a "reversion move" - not really a breakdown move (yet).
It will be interesting to see how this plays out.
If the markets move into Flagging, as I expect, the big opportunities will be to ride the Flagging & Breakdown patterns over the next 30+ days before we move into either an INVALIDATION or CONTINUATION phase of the inverted EPP pattern.
Price is the ultimate indicator - you just need to know what to look for.
Get some.
#trading #research #investing #tradingalgos #tradingsignals #cycles #fibonacci #elliotwave #modelingsystems #stocks #bitcoin #btcusd #cryptos #spy #gold #nq #investing #trading #spytrading #spymarket #tradingmarket #stockmarket #silver

SP500 Correction neededSP500 Correction needed
Technical picture of correction:
- Wedge - internal and external
- Finish of W3
- Long period of gains
- Oscillator 4H+ overbought

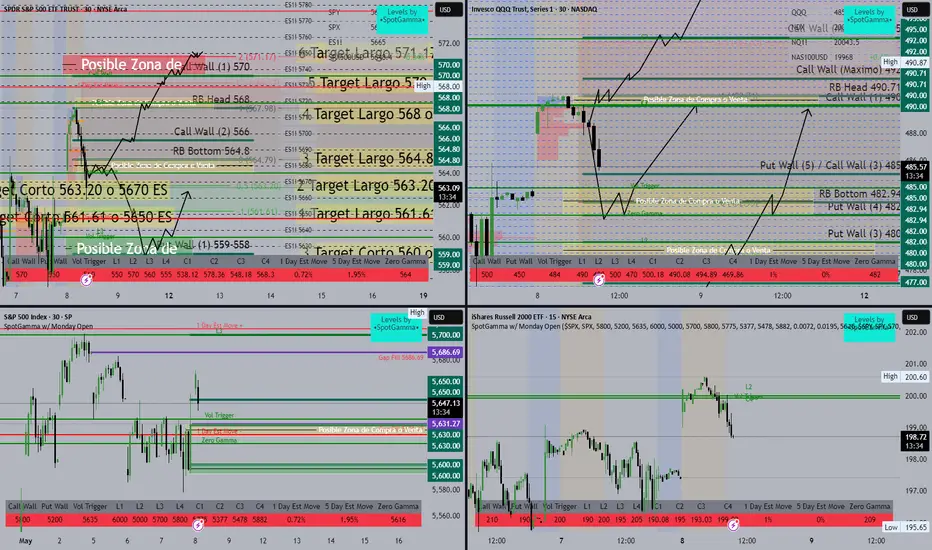
SPY/QQQ 8 de Mayo 2025SPY/ES Liquidity & Target Zones - Market Plan Overview
This visual map integrates liquidity levels, volume walls, and SpotGamma data to forecast key trading zones. Let's break it down in a structured format for better clarity and decision-making:
🔴 Possible Sell Zone / Final Target
Zone: Around 571.17 SPY or 5750 ES
Label: "Possible Sell or Final Target Zone"
Confluence: Call Wall (+1) at 579, significant resistance
🧠 This is a key exhaustion point for long positions. Ideal area to take profit or consider shorts.
✅ Upside Targets (Long Bias)
Target # SPY Level ES Equivalent Notes
6 571.17 5750 ES Extreme resistance zone
5 570 5740 ES Above Call Wall
4 568 5720 ES Matches liquidity cluster
3 564.8 5685 ES Near RB Bottom
2 563.20 5670 ES Mid-range pullback
1 561.61 5650 ES Close to mid gamma
🧠 These levels can be used for trailing targets or re-entries on pullbacks.
🔻 Downside Targets (Short Bias)
Target # SPY Level ES Equivalent Notes
1 563.20 5670 ES First major support
2 561.61 5650 ES Mid gamma support
3 560 5635 ES Near Zero Gamma and Put Wall
🧠 Breaks below these can trigger accelerated downside moves.
📈 Key Zones
Green Zone (Buy Zone):
559–558 SPY — Strong Put Wall and bounce probability area.
Yellow Zone (Flip Zone):
Around 564.79 SPY — Possible area of reversal, watch for reactions here.
Red Zone (Sell Zone):
Above 570 SPY — Watch for overextension and reversal signs.
🔍 Technical Tools Used
Call/Put Walls: Indicate dealer hedging areas and potential price magnets.
Volume Profile: Highlights high-activity price zones.
SpotGamma Levels: Used to identify gamma flip zones, walls, and trigger areas.
🔁 Possible Scenarios
Bullish Path:
Bounce from 561–563 range → Reclaim 564.8 → Push towards 568, possibly 570+.
Bearish Path:
Rejection at 564.8 or 568 → Breakdown below 561 → Test Put Wall at 559.
Nightly $SPY / $SPX Scenarios for May 6, 2025 🔮🔮
🌍 Market-Moving News 🌍
📉 Market Retreats Amid Tariff Concerns
U.S. stock markets declined on May 5, 2025, as investors reacted to potential tariffs and key earnings reports. The S&P 500 dropped 0.6%, and the Nasdaq decreased 0.7%. Notably, Palantir Technologies ( NASDAQ:PLTR ) fell nearly 8% in extended trading despite raising its full-year revenue forecast and exceeding Q1 revenue estimates.
🏛️ Fed Meeting Commences Amid Political Pressure
The Federal Reserve's two-day meeting begins today, with the central bank expected to maintain its benchmark interest rate at 4.25%-4.5%. Despite President Trump's calls for rate cuts, the Fed remains cautious due to inflationary risks from new tariffs and migration policies.
🎬 Entertainment Stocks Under Pressure
Streaming giants Netflix ( NASDAQ:NFLX ) and Disney ( NYSE:DIS ) experienced premarket losses of over 5% and 3%, respectively, following President Trump's proposal of a 100% tariff on foreign-made movies.
🏠 Housing Market Faces Challenges
The U.S. housing market is weakening due to persistent high mortgage rates and economic uncertainty driven by tariff policies. Mortgage rates, currently averaging 6.76%, have deterred both prospective buyers and sellers.
📊 Key Data Releases 📊
📅 Tuesday, May 6:
8:30 AM ET: U.S. International Trade in Goods and Services (March)
⚠️ Disclaimer:
This information is for educational and informational purposes only and should not be construed as financial advice. Always consult a licensed financial advisor before making investment decisions.
📌 #trading #stockmarket #economy #news #trendtao #charting #technicalanalysis

I SPY levels....It's a FOMC week (scheduled for Wed 5/7). So you can use your skills to scalp prior if you can.
Levels to mark...
*week hi/lo
*day hi/lo
those levels should be helpful when you spot intraday setups (if you can). if you can plan a strong $1 move, you can win $50. play to your strengths. that's all i'm going to do.

$SPY Possible simulation with COVID, Bottom at 495 then ATH 630Lowest RSI since COVID , highest daily volume for years! but if copy the wave of COVID drop we can see some similarities. bottom by 2nd week April at 495 then consolidation at 530 then up and fighting zone between 550-560 then up and small top on June/July then All time high in Sep at 630. the idea, take long dated strangles options

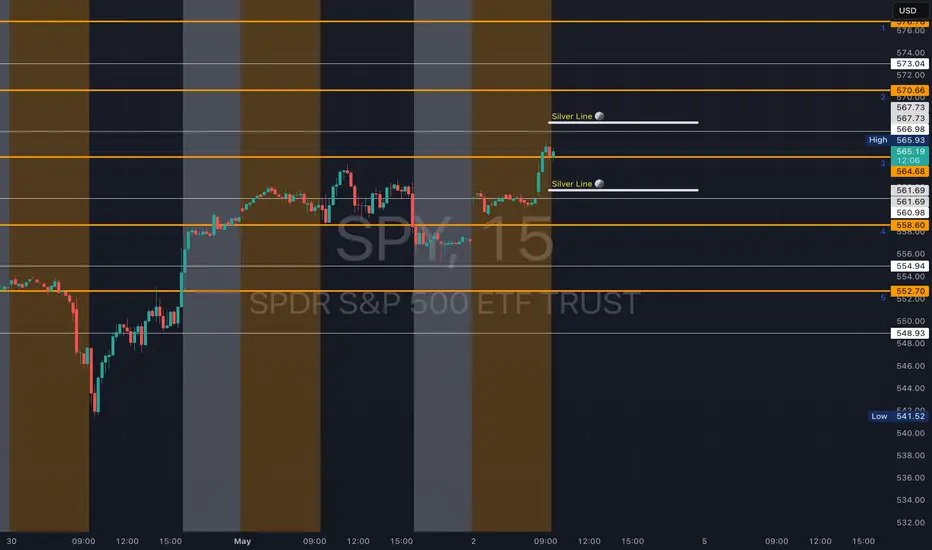
SPY - support & resistant areas for today May 2 2025These are Support and Resistance lines for today, May 2nd, 2025, and will not be valid for the next day. Mark these in your chart by clicking grab this below.
Yellow Lines: Heavily S/R areas, price action will start when closing in on these.
White Lines: Are SL, TP or Mid Level Support and Resistance Areas, these are traded if consolidation take place on them.
Silver Lines: An Area where price action could happen and do work on a choppy day.
SPY Trade Idea 4/24Currently ranging from 510s to 545s
Keep tight stop due to 548 to 562 gap
Let me know what you think
Have a great day

$SPY Trapped in a Bear Gap - May 2 2025 contract AMEX:SPY
How interesting that we traded completely within the bear gap yesterday .
First time above the 50 Day moving average in quite a while. 50 Day MA pointing us lower along with the 1hr underneath us.
Let’s go. Today’s Range looks like a fun way to close the week.

Nightly $SPY / $SPX Scenarios for May 2, 2025🔮 Nightly AMEX:SPY / SP:SPX Scenarios for May 2, 2025 🔮
🌍 Market-Moving News 🌍
🇺🇸 Rising Unemployment Claims Signal Labor Market Softening
Initial jobless claims increased by 18,000 to 241,000 for the week ending April 26, marking the highest level since late February. Continuing claims also rose to 1.916 million, indicating potential cracks in the labor market.
🏭 Manufacturing Sector Contracts Amid Tariff Pressures
The ISM Manufacturing PMI fell to 48.7 in April from 49.0 in March, indicating a second consecutive month of contraction. Tariffs on imported goods have strained supply chains and elevated input prices, contributing to the downturn.
📉 Construction Spending Declines
Construction spending decreased by 0.5% in March, reflecting reduced investments in both residential and nonresidential projects. This decline suggests caution in the construction sector amid economic uncertainties.
📊 Mixed Signals from Manufacturing Indices
While the ISM Manufacturing PMI indicates contraction, the S&P Global Manufacturing PMI remained steady at 50.2 in April, suggesting stability in some manufacturing segments despite broader challenges.
📊 Key Data Releases 📊
📅 Friday, May 2:
💼 Nonfarm Payrolls (8:30 AM ET)
Provides insight into employment trends and overall economic health.
📈 Unemployment Rate (8:30 AM ET)
Measures the percentage of the labor force that is unemployed and actively seeking employment.
💰 Average Hourly Earnings (8:30 AM ET)
Indicates wage growth and potential inflationary pressures.
🏭 Factory Orders (10:00 AM ET)
Reflects the dollar level of new orders for both durable and nondurable goods, indicating manufacturing sector strength.
⚠️ Disclaimer:
This information is for educational and informational purposes only and should not be construed as financial advice. Always consult a licensed financial advisor before making investment decisions.
📌 #trading #stockmarket #economy #news #trendtao #charting #technicalanalysis

SpyApril seasonality finally showed its self this past week.. You can always tell when seasonality takes over because of the volume and the fact that news doesn't matter anymore.
Example - March, Sept and sometimes May are bearish seasonality.. In these months you'll notice that no matter how good the news or earnings stock still stumble...
Nov, Dec, April are bullish and most of the time no matter the bad news things just pump or get bought up for no reason.
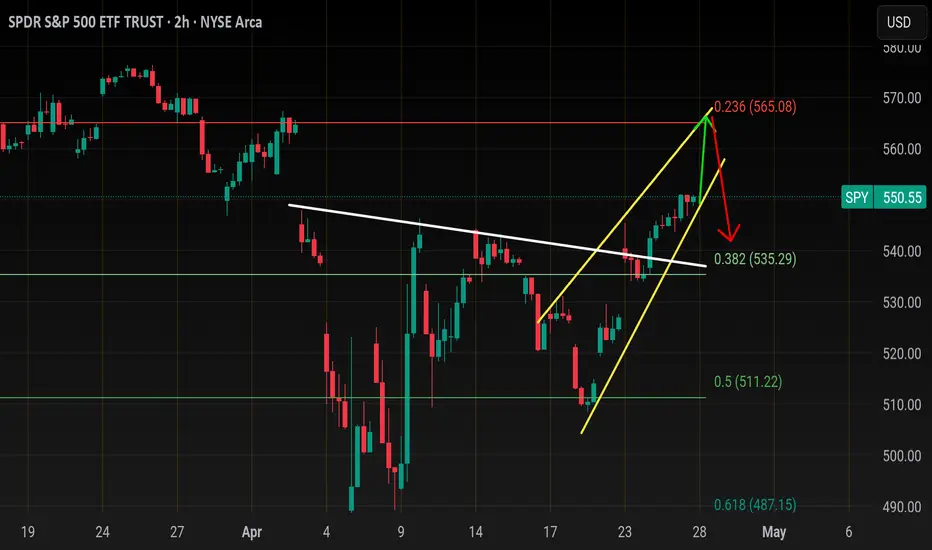
I think spy goes for 565.00 this week, which is only another 3% higher. To put this in perspective, Spy was 536 on 4/23 and melted up 3% in two days on no volume ..
At 565 I think there will be a very nice short opportunity where I think spy will pull back to to 540-545.. I wouldn't short this before 565, and this only becomes bearish again if spy closes next week below 535.00!
Now here's the chart
TVC:DJI
Very low key late this week.. contrary to qqq the dji has not broken above its trend line resistance but I think that will happen this week and it most likely will off set any draw done from big tech.. imagine a day where dow jones is up 400pts and nasdaq down 150pts; this price action would lead spy to chop in the middle FAWKERY.
The upside target here is APRIL 2ND gap close
NASDAQ:QQQ
Yellow trendline is breakout
White trendline is April 2nd gap close
Red line is - 20sma
So like I said above, qqq is leading the way up to April 2nd gap close. This gap close at 476 is about 5% aways from the 20sma.. I think once qqq tags 476 it will begin a pullback to 465-468.. during this pullback you will see them pump the dow. As long as 465 holds then 488 is next or weekly 50ma. If we lose 465 then a full 20ma retest is incoming..
To keep it simple, long qqq early to 476 then wait for a pullback or short it back down to 465-468.. if those areas hold then switch back long and ride it up to 480+
Vix
Minor falling wedge showing at gap support 24.80 .. if this pattern plays out thin Vix could pop back up to 31 or 20sma which could see markets start the week in the red but unless vix can reclaim 32.00 then this is just a dead cat bounce that will give you a good entry to long equities
I won't go into the tech Sectors but the overall picture I think is a melt up to the WEEKLY 50MA on Sectors and indexes
I still can't see this market overall making significant ground to ATH.. the leading INDEX TVC:NYA is showing a Decade long Rising wedge which is the biggest I've ever seen.
Since 2010 this resistance has not broken and If spy pushes back up near 600 then NYA will tag this again which means we are headed back down before the summer is out. Once this rising wedge is broken will make new lows and break below 400
In closing... Spy supports are
547 (Price action)
543 ( 1hour 200ma)
537( 20ma daily)
I don't think spy will lose 543 before 555 comes... once you see NASDAQ:QQQ tag 476 be weary of being long, wait for the pullback then long NASDAQ:QQQ and AMEX:SPY to their weekly 50ma
Opinion
Job numbers are released this week Friday which is the beginning of "SELL in MAY " seasonality.
All of the fed speakers have said that if jobs come in strong than they won't vote for a cut.
Feds don't cut on May7th and Trump throws a tantrum and market sells again..
This scenario is the reason I think the market will maximize these big tech earnings to get the upside move out of the way before early may. Also next month the economic data (Ppi,cpi,pce,pmi) will give the first glimpse of what damage the tariff are doing / will do.
So buckle up come May