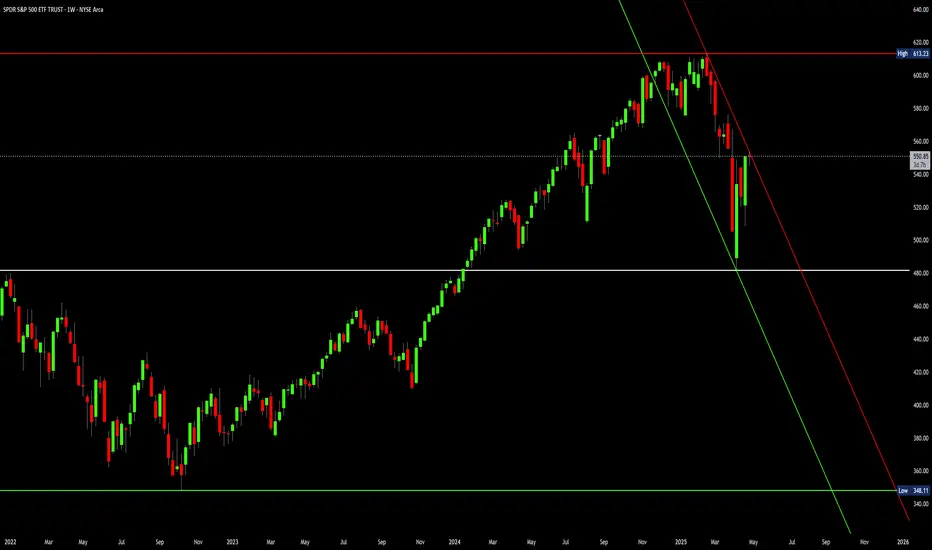
$SPY bear flag target between $387-443AMEX:SPY has been consolidating in a bear flag since April 7th. Should we break down from the flag, I can see a sharp move down to the lower support levels.
I think the most likely targets are at $443 and $409. However, it's possible we can find support at the other targets as well.
I think the move likely plays out before June. Let's see where we end up bouncing.
Invalidation of the downside would be a break over $567.
SPY trade ideas

SPY bear market?The causes of a bear market often vary, but in general, a weak or slowing or sluggish economy, bursting market bubbles, pandemics, wars, geopolitical crises, and drastic paradigm shifts in the economy such as shifting to an online economy, are all factors that might cause a bear market.
One definition of a bear market says markets are in bear territory when stocks, on average, fall at least 20% off their high. But 20% is an arbitrary number, just as a 10% decline is an arbitrary benchmark for a correction. Another definition of a bear market is when investors are more risk-averse than risk-seeking. This kind of bear market can last for months or years as investors shun speculation in favor of boring, sure bets.
SPY macro levels:
resistance: 613
pivot: 480
support: 348
SPY (worst is over?)Excellent buy side volume this week following by one down gap fill. We are at resistance currently so I would expect a lot of chop before resumption up trend. Make sure you check which security is showing strength during the down days of the chop. They might become the future market leaders.

Leaving Breadcrumbs For A Swing Or Setting A Trap?In my previous idea, I explained why I think the price could rise to the $580s and just wanted to provide a brief update on what I’m watching for this week. The market has felt lethargic recently despite rising roughly 8.25% over the last five sessions. The days of fretting over incremental movements feels like a distant memory. Fortunately, major data releases and large cap earnings should energize the market. While “C” waves are not required to meet specific sub-wave retracements, and can go straight to their targets without a significant pullback, we should still be prepared for the possibility of being faced with market whiplash. Taking all of this into account, I think there could be a pullback - especially after noticing an important clue right in front of me.
AMEX:SPY has been rising higher for the last five sessions in a jerky uptrend from last week’s lows and is close to filling a gap/imbalance at the $555 level on the daily chart. There is also a gap from $529-$534, however the price is much closer to filling the upper gap.
Other things I’m taking note of on the daily chart are the declining volume and a MA cross confirmation. The moving averages I’m using here are HMA (13; pink) EMA (34; yellow) and SMA (200; green), and I have found the Hull Moving Average crossing the Exponential Moving Average to be a fairly reliable indicator of a reversal. HMA will cross up on Tuesday if the price stays above the EMA.
For a different perspective, the 1000R ($10) chart shows the price action a little more smoothly. I noticed that for the month of April, each time the price swung lower, it did so by around $35. If it is assumed that this pattern continues for one more swing lower in what would be wave (b) of C, the next question would be: to which retracement level it would go?
There are a lot of people on the boards who think the price will move lower on Tuesday. If the price were to fall from around Monday’s close of $550, a $35 drop would take the price back to around $515, which would result in an approximately 80% retracement of wave (a). There is nothing wrong with this, and the price could reverse and extend to $580 from there, however I think such a deep retracement into wave (a) is the less likely scenario since the goal of this larger corrective wave is to keep the momentum moving higher to sell before the market tanks. I still charted it above to show what that would look like.
Alternatively, I am expecting SPY to move higher on Tuesday and pull back Wednesday and Thursday to continue printing what appears to be clean and proportional movements here in the first major corrective wave of the bear market.
The week ahead will have several events that could determine the market’s direction. The most important news should come from GDP and Core PCE data being released before the open on Wednesday. Regardless of how the market reacts, we can assume with relative confidence that the news will contribute to a large movement in price. Since I’m suggesting a $35 move down will happen at some point, I am anticipating Wednesday will start this movement.
Above the $555 gap there is an order block that the price should be gravitating towards. This would be an ideal area to absorb buy orders before SPY gets sent down. Taking an educated guess, $565 could be a key level that marks the end of wave (a). A $35 reduction from there would see the price retrace 61.8% (0.382 level on the chart) to $530. Since there is another gap around this level, it should be a logical area for the price to move next before beginning its final rise to around $580.
…
This idea makes more assumptions than my last one, so please trust your own instincts and form your own opinions. The market can be unpredictable, so patterns can fail at any time. This is why it is important to stay vigilant.
With that being said, I expect Tuesday to be another low volume day that could take the price in any direction; including sideways. Since Wednesday’s data should be a major driving force for price activity this week, it is important to assess which level the market is targeting just before the news comes out. We’ll see what happens, but I think institutions are going to look to prolong this corrective wave while they still can and offload shares at a good price, because the next time this sells off it will go much lower.
I appreciate all of the feedback I received on my last post, and if you enjoyed this one I’d love to know what you think. Good luck to all.

SPY Day Trade Plan for 05/01/2025SPY Day Trade Plan for 05/01/2025
📈 562.70 565.60
📉 557 554.30
Thanks to all my followers! Truly appreciate the support!
Please like and share for more ES/NQ levels Tues & Thurs 🤓📈📉🎯💰
*These levels are derived from comprehensive backtesting and research and a quantitative system demonstrating high accuracy. This statistical foundation suggests that price movements are likely to exceed initial estimates.*

Gambling Is Not Trading : A Quick Reminder to THINKI've been getting quite a few messages from followers and many are positive. I seems my videos are helping many of you learn better skills and helping you find profits from these bigger price swings.
But it also seems some of you are really gambling for the bigger gains with 0DTE options and taking excessive risks (IMO).
I want to urge all of you to THINK and to try to learn to adopt a more fluid style of trading.
The markets will quickly humble many of you gamblers. They have a way of taking everything you have when you let your guard down.
Start Small.
Build Your Skills.
Learn How To Check Yourself When You Get Into That Gambling Mode.
Remember, The Market Can Take EVERYTHING (And MORE).
The trick to trading is to learn to GROW your account without gambling. It is like being a Sniper.
You have to learn when to take your shot and you also have to learn when to be patient and wait.
One of the best pieces of advice I've heard came from a friend (who trades options). He stated.
Start Small
Book Winners Quickly
Book Anything over 20-25%
-- Then Plan For The next Attack.
Think about it.
He's been trading for more than 20 years and has learned many of the pitfalls over that time. And, he is the one guy that I've seen generate 100-200%+ a week (consistently) over the past 2+ years.
If you want to survive as a trader, you have to start thinking like a trader (not a GAMBLER).
I hope this video helps.
Get some.
#trading #research #investing #tradingalgos #tradingsignals #cycles #fibonacci #elliotwave #modelingsystems #stocks #bitcoin #btcusd #cryptos #spy #gold #nq #investing #trading #spytrading #spymarket #tradingmarket #stockmarket #silver

Opportunity Beneath the Fear: SPY's Reversal SetupIn the Shadow of Headlines: SPY’s Drop Could Be 2025’s Big Opportunity
As markets react sharply to renewed tariff fears and Trump-related headlines, SPY continues its descent. Panic is setting in—but behind the noise, a strategic opportunity may be quietly forming.
While many rush to exit, others are beginning to position for the bounce. A well-structured entry strategy could be key to turning uncertainty into gains.
Entry Zone (Staggered):
🔹 543: First watch level—look for signs of slowing momentum.
🔹 515: Deeper entry point as the selloff extends.
🔹 <500 (TBD): Stay flexible—if panic accelerates, this could mark a generational setup.
Profit Targets:
✅ 570: Initial rebound target.
✅ 590: Mid-range level if recovery builds.
✅ 610+: Full recovery potential—rewarding those with patience and vision.
Remember: Headlines fade, but price action and preparation stay. This selloff may continue—but it might also be laying the foundation for 2025’s most powerful move. The key? Enter with discipline, protect your capital, and let the market come to you.
⚠️ Disclaimer: This content is for educational purposes only and does not constitute financial advice. Trading carries significant risk. Always conduct your own research and use proper risk management.

SPY Green Light to All Time Highs?As VIX is sitting around 25, this is the first Monday in I can't remember how long we aren't gapping down at open! I'll take it! There is a ton on the calendar this week: jobs, first print for Q1 GDP, PCE, ISM mfg, and a ton of consequential earnings! Not to mention will we get a couple deals announced this week. Feels like India, UK and Japan are close. This could spur a market rally to continue! Did a ton of work on Elliott this weekend, but didn't create a video. Essentially, since we closed in the wave 1 of the red C leg (on daily and weekly basis), we have invalidated a chance of a fifth leg lower (thank God!). This means we are in first impulsive intermediate 5 wave that should go to all time highs (next Apr)! Since we already have two minute impulsive waves that were similar in size, we likely will finish the minor wave 3 as pictured and then since 1 & 3 of minor waves will be similar in size the impulsive 5 wave target will be as pictured as well. Remember it is simply the net of waves 1 through 3 times 0.618 and add that to the finish of wave 4 in either case. After wave 3, we will get a pullback, but this will be a buy the dip opportunity finishing the 5th wave around 580ish. After this we will get a deeper corrective wave but if sentiment is positive it may be shallow, only 38% to 50%, so will want to re-evaluate at that point! This is why it is important if you are investing not to FOMO, as there will be many opportunities to buy the dip!

SPY - 700 is not impossibleA sneaky expanding diagonal for cycle wave 5 with a blow off extended 5th primary wave (final wave) makes the most sense to me. If that's what we are seeing right now, SPY might possibly hit low 700s in the next couple of years. Gold might pull back to low 200s in the meantime for a choppy wave 4. My plan is to switch from equities to gold at spy 700. Not a financial advice. This post is for educational purpose only

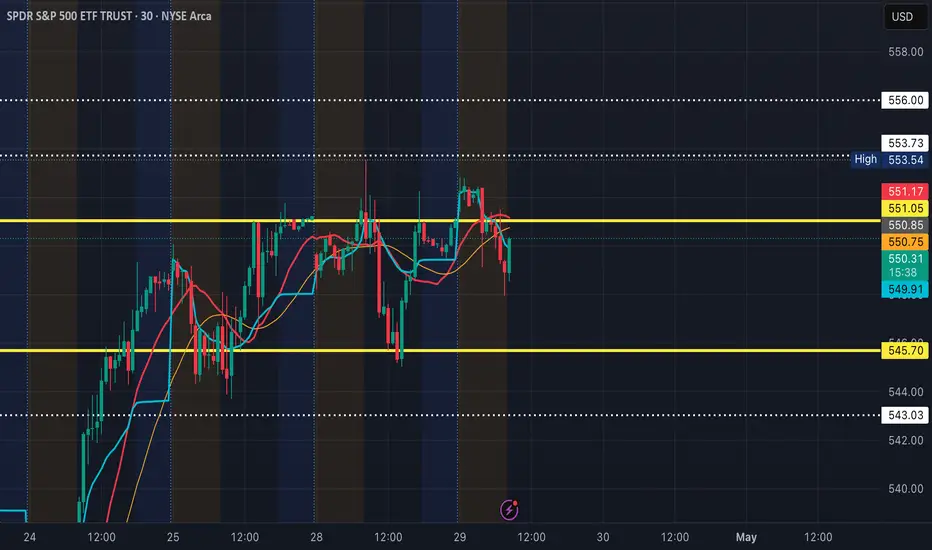
SPY Day Trade Plan for 04/29/2025SPY Day Trade Plan for 04/29/2025
📈 550 553 556
📉 544 543 540.50
Thanks to all my followers! Truly appreciate the support!
Please like and share for more ES/NQ levels Tues & Thurs 🤓📈📉🎯💰
*These levels are derived from comprehensive backtesting and research and a quantitative system demonstrating high accuracy. This statistical foundation suggests that price movements are likely to exceed initial estimates.*
SPY Gap Fill $564.66SPX futures has a gap on the tariff announcement (see my ES plots), SPY has to hit $564.66 to fill that gap. I'm busy moving this week, so not playing it. Besides it looks like it's gonna whipsaw its way up anyways.

$SPY - Recap of Last Week
Last week we had a from bottom of the week on Monday to top of the week on Friday an 8.25% move
We opened the week with a gap down and dropped hard on Monday - and then up from there.
Tuesday gap up
Tuesday was TSLA earnings in after-hours.
Gap up Wednesday then drop back down to the 35EMA and a pretty solid squeeze into the end of the week.
So do we get violently slapped out of that gap?

SPY – April 29, 2025 – Where to Next After This Push?Looking at SPY on the daily chart, it’s been riding a solid recovery wave from that sharp drop in early April. The last seven sessions have all printed green candles, showing persistent demand — but now we’re pressing right into the resistance zone around $554–$555, which aligns with the top of a previous range before that breakdown. The MACD histogram is still rising, showing bullish momentum, and the Stoch RSI is curled up in overbought territory. That’s not a sell signal on its own — it just means we’re extended and probably due for a cooldown.
When I zoom into the 1-hour chart, I notice something more subtle — SPY has been grinding up within a rising wedge. The candles are getting tighter near the top channel line, and volume is starting to fade a bit. That tells me we’re at a spot where either momentum explodes higher... or this move starts to stall out.
Now, overlay that with the GEX map, and here’s what jumps out:
* $555 is a thick cluster of Call Wall and Net GEX resistance — 44.9% of second-tier call positioning is stacked there.
* Above that, $557–$560 also has GEX walls, so upside beyond $555 could get sold into unless we see strong breakout volume.
* On the flip side, $547 and $545 remain the nearest areas of downside gamma support — price tends to bounce off these zones if tested.
My Thoughts: We’re reaching a point where the path of least resistance might shift. If bulls can decisively break above $555, especially with volume and a GEX unwind, there’s room toward $557–$560. But if we get stuck here and break below $552, I’d expect some profit-taking down toward $547–$545.
Trade Setups I’d Consider:
* Bullish Breakout Trade:
Above $555 with volume
Entry: $556
Target: $559–$560
Stop: $553.50
(Ideal with IV still relatively low and GEX unwinding from that zone)
* Fade Rejection Play (If SPY can’t clear $555):
Entry: ~$554 with reversal candle
Target: $547
Stop: $556
(Volume weakness + rising wedge breakdown would support this)
Options Thoughts:
* IVR is at 29, with IVx lower than the average — premium is relatively cheap.
* GEX shows 89% PUTs, which might seem bearish, but it also suggests market makers could support pullbacks for now.
* A $555C or $560C for this week is a high-risk chase — I’d only grab it if SPY breaks and holds above $555.
* Safer might be a put debit spread targeting $547 if the rising wedge breaks down.
This week could be pivotal. SPY has had a strong run, but now it’s flirting with a crowded options zone. Watch the $555 level closely — that’s where the real decision likely gets made.

Weekly $SPY / $SPX Scenarios for April 28 – May 2, 2025🔮 🔮
🌍 Market-Moving News 🌍
🇺🇸 President Trump's 100th Day in Office: Wednesday marks President Trump's 100th day of his second term. His administration's protectionist tariffs continue to influence global markets and political landscapes, with notable impacts observed in Canada, Australia, and the UK.
📉 Trade Tensions and Economic Indicators: Investors are closely monitoring the effects of recent U.S. tariffs on economic performance. Key data releases this week, including GDP and employment figures, will provide insights into the economy's resilience amid these trade policies.
💼 Major Corporate Earnings: This week features earnings reports from major companies, including Apple, Amazon, Microsoft, Meta Platforms, ExxonMobil, and McDonald's. These reports will offer a glimpse into how large corporations are navigating current economic challenges.
📊 Key Data Releases 📊
📅 Monday, April 28:
🏠 Housing Vacancies and Homeownership (10:00 AM ET):
Provides data on rental and homeowner vacancy rates, offering insights into housing market dynamics.
📅 Tuesday, April 29:
📈 Advance Economic Indicators (8:30 AM ET):
Includes data on international trade in goods, wholesale inventories, and retail inventories for March.
📊 Consumer Confidence Index (10:00 AM ET):
Measures consumer sentiment regarding current and future economic conditions.
💼 JOLTS Job Openings (10:00 AM ET):
Reports the number of job openings, indicating labor market demand.
📅 Wednesday, April 30:
📈 GDP (Q1 Advance Estimate) (8:30 AM ET):
Provides an early estimate of economic growth for the first quarter.
💳 Personal Income and Outlays (10:00 AM ET):
Includes data on personal income, consumer spending, and the PCE price index, the Fed's preferred inflation measure.
🏭 Chicago PMI (9:45 AM ET):
Assesses business conditions in the Chicago region, reflecting manufacturing sector health.
📅 Thursday, May 1:
🏗️ Construction Spending (10:00 AM ET):
Reports total spending on construction projects, indicating economic activity in the sector.
📉 Initial Jobless Claims (8:30 AM ET):
Measures the number of new filings for unemployment benefits, reflecting labor market
conditions.
🏭 ISM Manufacturing PMI (10:00 AM ET):
Provides insight into the manufacturing sector's health through a survey of purchasing managers.
📅 Friday, May 2:
👷 Nonfarm Payrolls (8:30 AM ET):
Reports the number of jobs added or lost in the economy, excluding the farming sector.
📉 Unemployment Rate (8:30 AM ET):
Indicates the percentage of the labor force that is unemployed and actively seeking
employment.
🏭 Factory Orders (10:00 AM ET):
Measures the dollar level of new orders for both durable and nondurable goods, indicating manufacturing activity.
⚠️ Disclaimer: This information is for educational and informational purposes only and should not be construed as financial advice. Always consult a licensed financial advisor before making investment decisions.
📌 #trading #stockmarket #economy #news #trendtao #charting #technicalanalysis

Nightly $SPY / $SPX Scenarios for April 30, 2025 🔮
🌍 Market-Moving News 🌍
🇺🇸 Bessent's Trade Remarks Stir Markets
Treasury Secretary Scott Bessent emphasized the U.S.'s readiness for a significant trade deal with China, suggesting potential easing of the ongoing tariff war. His comments have heightened investor anticipation for developments in U.S.-China trade relations.
📉 China's Factory Activity Contracts
China's April manufacturing PMI is projected to fall below 50, indicating contraction, as recent U.S. tariffs impact production. This downturn raises concerns about global supply chain disruptions and economic slowdown.
💼 Major Earnings Reports on Deck
Investors await earnings from key companies including Apple ( NASDAQ:AAPL ), Alphabet ( NASDAQ:GOOGL ), Meta Platforms ( NASDAQ:META ), Microsoft ( NASDAQ:MSFT ), and Amazon ( NASDAQ:AMZN ). These reports will provide insights into how tech giants are navigating current economic challenges.
🏛️ Treasury's Borrowing Plans Under Scrutiny
The U.S. Treasury is set to release its quarterly refunding announcement, detailing borrowing plans amid economic uncertainties and the impact of recent tariffs. Market participants will closely analyze the guidance for implications on interest rates and fiscal policy.
📊 Key Data Releases 📊
📅 Wednesday, April 30:
📈 Q1 GDP (8:30 AM ET)
Forecast: 0.3% QoQ
Previous: 2.4%
Initial estimate of U.S. economic growth for Q1, reflecting the early impact of new trade policies.
📈 ADP Employment Report (8:15 AM ET)
Measures private sector employment changes, offering a preview of the official jobs report.
📈 Chicago PMI (9:45 AM ET)
Assesses business conditions in the Chicago area, serving as an indicator of regional economic health.
⚠️ Disclaimer: This information is for educational and informational purposes only and should not be construed as financial advice. Always consult a licensed financial advisor before making investment decisions.
📌 #trading #stockmarket #economy #news #trendtao #charting #technicalanalysis
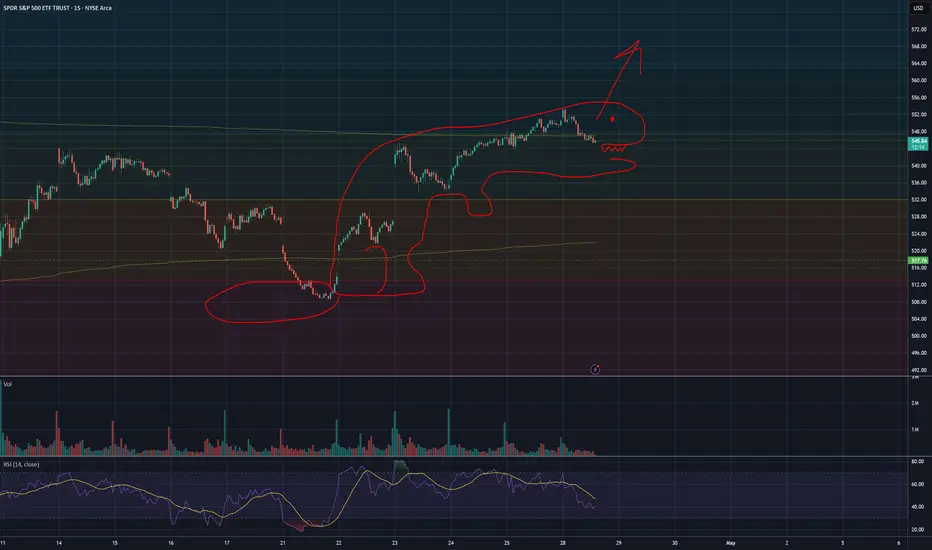
Clear TREX pattern forming on SPY.clearly you can see we formed trex leg and arm, and now the head structure is complete. target points are smewhere around 9999. enter long now or trex will engulf all your profits.
good luck...
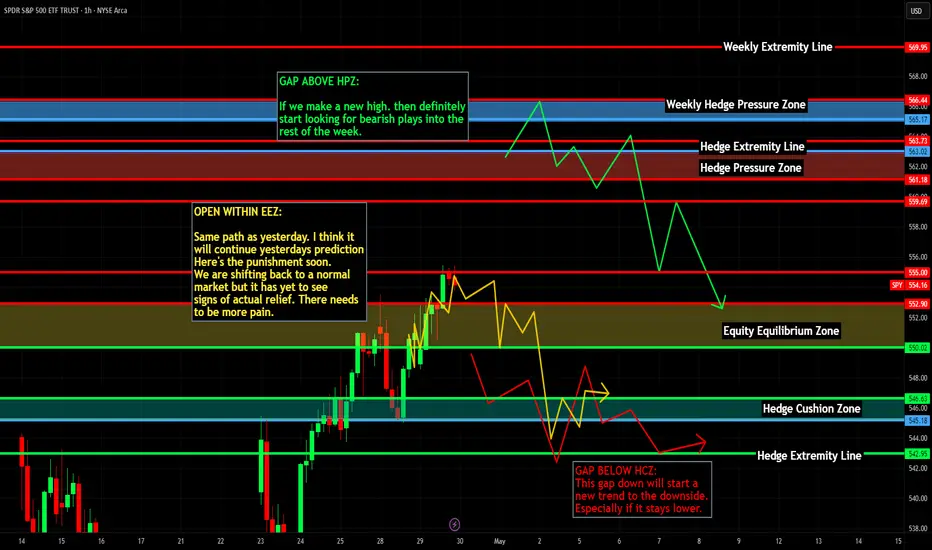
SPY/QQQ Plan Your Trade Update : Playing Into The Major BottomThis update highlights what I believe will be the last level of defense for price (support) on the SPY and why it is so important to HEDGE the markets right now.
The upward price move has reached the ULTIMATE HIGH (I believe) and is now moving into a Bullish EPP pattern (shifting into the downward pullback, then it will move into the flagging phase).
This flagging phase will be the deciding move (IMO) related to IF the markets attempt to break upward or downward near the current Fib 50% level.
This is why it is so important to HEDGE all open positions right now.
This battle zone in the markets (near the Fib 50% level) is not a guaranteed move higher or lower. Basically, we are watching the battle take place in live trading.
What we can do is try to rely on the EPP patterns and other formations to help guide us to the highest probable outcome, but we have to stay liquid and fluid as the markets trend.
Right now, I would suggest the breakdown (Major Low) outcome is about 70-80% likely. Thus, the breakaway (upside) outcome may be 20-30% likely based on my analysis.
But that could change if the SPY moves above $555.
Thank you again for all the great comments. I'm trying to help as many traders as I can. But this move to the 50% level is very "indecisive". So, I'm having to rely on Fibonacci Price Theory and other techniques (money management/HEDGING) as a way to protect my capital while I trade.
This is a great example of how you can learn techniques (beyond technical analysis) related to what to do when you really don't know what the markets may do in the near future.
The answer is HEDGE ACTIVE POSITIONS - or pull trades off (even if they are at a loss) and then HEDGE whatever you want to keep active.
No one is going to laugh when you tell them, "I protected my capital by hedging last week" when they are looking at severe losses and you are NOT looking as severe losses.
It is SMART TRADING.
Get some.
#trading #research #investing #tradingalgos #tradingsignals #cycles #fibonacci #elliotwave #modelingsystems #stocks #bitcoin #btcusd #cryptos #spy #gold #nq #investing #trading #spytrading #spymarket #tradingmarket #stockmarket #silver

Bias is still upBias is still up and likely the wedge fills out today. A strong move up after open may be sold into.


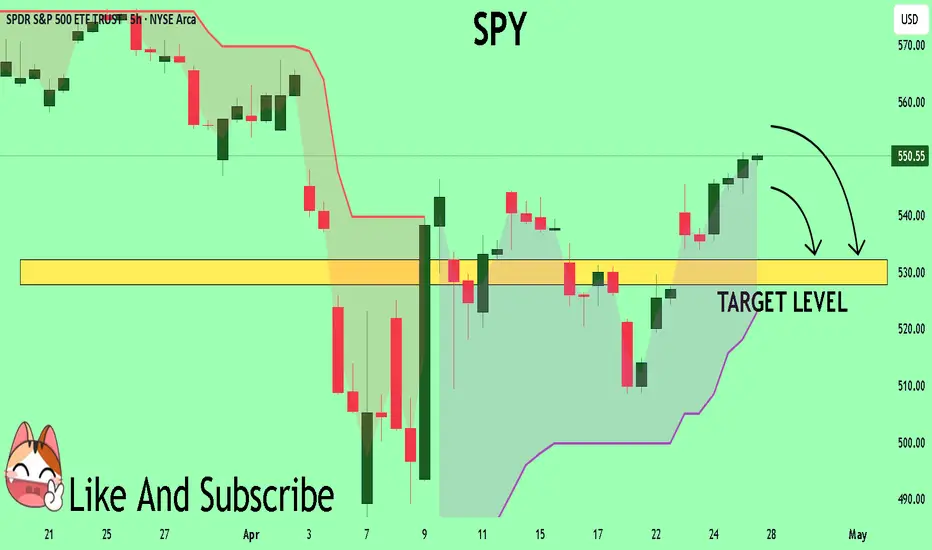
SPY Buyers In Panic! SELL!
My dear subscribers,
This is my opinion on the SPY next move:
The instrument tests an important psychological level 550.55
Bias - Bearish
Technical Indicators: Supper Trend gives a precise Bearish signal, while Pivot Point HL predicts price changes and potential reversals in the market.
Target - 532.22
About Used Indicators:
On the subsequent day, trading above the pivot point is thought to indicate ongoing bullish sentiment, while trading below the pivot point indicates bearish sentiment.
Disclosure: I am part of Trade Nation's Influencer program and receive a monthly fee for using their TradingView charts in my analysis.
———————————
WISH YOU ALL LUCK
I SPY an opportunity to riseThe "macro" environment has an extreme bearish tone. There is a great deal of uncertainty still. So let's look to the charts to see what's the deal. Monday morning was a spill over from Trump's tantrums and we bounced at the end of the day Monday with a wick. Interesting note... big tech earnings was beginning. What a perfect time to see some rise on the charts.
NFLX already had us anticipating some positive movement b/c of their Good Friday earnings. So most people were focused on the play of 1000-1100. So many people took a position.
Back to SPY... Trump stated after hours after during TSLAs awful earnings call that he was not going to fire JPowell and TSLA began rallying as well as other big tech companies (interesting). The rallies held overnight. There were selloffs after the earnings, creating HL (higher lows) that held across many charts. The week proceeded and we slowly rose the rest of the week.
I'm recalling that Trump initiated a 90 day pause. & though their is still negative chatter and uncertainty with the final outcome; it's enough to have bullish thoughts for the remainder of the earnings season (esp big tech and major companies) while we chop.
Cautiously viewing the charts one day at a time; watching for candlestick patterns to assist with plays. If the pattern is bullish, looking for a bullish play. if the pattern is bearish, looking for a bearish play. Or... just pick a side and wait for what you connect to. My notes on candle recognition below over the next week will be below.
Tootles

SPY EARNINGS WEELY AAPL AMZN MSTR METASPY WEELY - Apple, Amazon, Microsoft, and Meta will report earnings.
This week we have important earnings from Microsoft, Amazon, Apple, and Meta. We believe there could be a strong move in the SPY driven by the earnings reports, as well as by key economic data like unemployment figures, GDP, and Consumer Confidence. Based on these factors, we expect high volatility and see the potential for the SPY to move within the range of 530–520 on the downside and 560–580 on the upside.

$SPY April 28, 2025AMEX:SPY April 28, 2025
15 Minutes.
We had 3 days without any gap issues.
So, Some consolidation.
So, if we take the low 508.46 as bottom for the last fall then for the extension 508.46 to 544.44 to 533.8, we have 557 as initial target.
A retracement to 538-542 levels will be good as averages will converge slightly for a move towards 563.
For this holding 533-534 is very important.
