VUG Monthly Symmetry 21 months from pandemic low to high. 50% correction (10 months). Then another 21 months to July 2024 high. Also, a low to high, high to high correlation.
Market insights

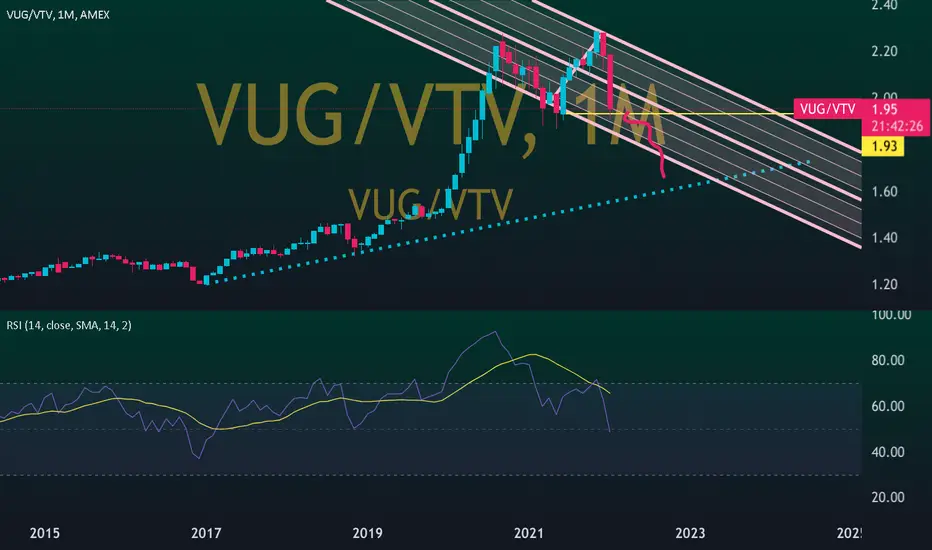
Growth stock's hiatus ?Growth stocks outperform value stocks most of the time on a weekly chart of $VUG / $VTV, Vanguard's growth and value elf's respectively.
Since the start of the 2022 bear market that relationship has reversed and, in August 2022, broke both horizontal support as well as a 14 year long diagonal support.
These breakouts are being retested now, in January 2023. The outcome can impact both trading and long term investing strategy.
For reference:
$SPY in the bottom pane. Today's close: 400.35
Fib tool (not formal analysis)

BTC and VUG (Vanguard growth ETF) comparison. VUG weekly chart with BTC overlayed. The VUG 200 MA has held up well as strong support for the market in the past. Could this be the bottom before the markets start recovering. Any thoughts or insights are appreciated.


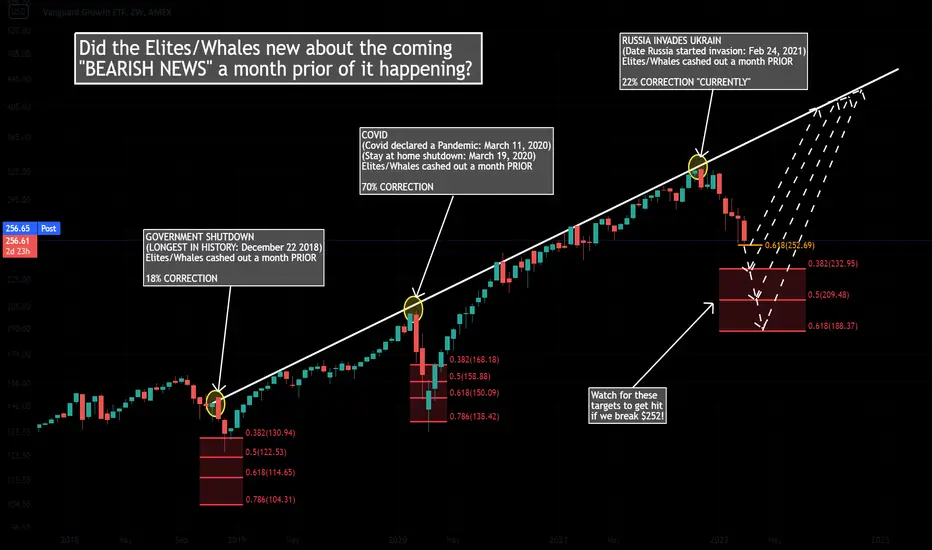
VUG - THEY knew about the corrections a month prior!THEY have the advantage of getting the "news" before the whole world hears about it.
Whales/elites will not miss any opportunities into making money. They simply buy the fear, hype up the market, take profit and crash it again after taking profit. Instead of beating then, lets ride with them! ;)
Before reading, get rid of your moonboy mentality and no emotions for dips/corrections! Cannot rule bearish scenarios! Dips are for buying!!
People are so focused on the hourly/daily timeframe that they get emotional on every dip! Take a step back to the weekly/monthly timeframe and see why I'm so bullish now. Stop looking at the short-term dips/rise. Short term is irrelevant for the move that is coming!
You can't be emotional in these markets (stocks, forex, crypto, real estate, etc.). You will lose this game following the news and doing what the majority does. News creates emotions. Everything you need to know are on the charts. News is manipulated by the elites, and they take advantage of our emotions. Stop listening to the news and pay more attention to the charts. Don't follow the majority, because the majority will lose in the end! Also, don't buy the hype when everyone is buying.. instead buy the fear when everyone else is selling
Everything is on the chart! Cryptocurrencies are on the verge of exploding higher. Dips/Corrections are normal and needed in a bull market and are buying opportunities! Huge gains opportunity in the coming months! Never trade blindly. Use multiple indicators to make calculated decisions. Trade with no emotions!
"If you can't beat the fear, do it scared!"
"Be fearful when others are greedy, and greedy when others are fearful!" - Warren Buffet.
"Markets are a device for transferring money from the impatient to the patient. - Warren Buffet
"Show me the charts, and I'll tell you the news." - Bernard Baruch
"The secret to investing/trading is figuring out how rich you want to be and how poor you're willing to become."
"If you want to live like the 5% of the population who are hugely successful, then don't act like the 95%!"
2018 Repeat - Growth stocks could still drop 15% before bounceFor growth stocks, I matched the pattern from 2018 to the current trading channels. If true, then there could be up to 15% downside in the coming weeks. The good news is that we could see a sizeable (30%) rebound afterwards.

Deep Fkn ValueWhilst i think we're going into a bear market
I think deep fkn value stonks
Will probs do quite well from here
Here we have growth/value which should return to trend
GRI 2022
a BTC indicator for falling price how low can we go VUG etf[This may be great indicator on the capitulation of price at end of carnage short term for BTC .Look at VUG etf price an if we see the dip close below 300 we can anticapate a 30K price in BTC. This will be a tremendious last chance to see this price in short term to buy it up ? I think this is it now game on lets go guys stay on up an up keep cool knowing your next best trade is incoming with this price fall.
Not if VUG does not bounce at 300 look for cintinuation on price action decline

Growth vs Value - Potential Double Top with Inverse TrampolineThe growth/value ratio showed an inverse trampoline as
it retested a prior peak (possible double top). The daily
is shown as well to illustrate a further inverse trampoline
in concert with the weekly. My plan doesnt allow for
showing an intraday ratio chart, otherwise the hourly
would be shown as an even earlier entry was likely afforded.
Hope this provides some insights.


Growth vs Value: Outperformance in growth namesI think we are entering a period similar to that of April 2020 to September 2020, and growth names will outperform value stocks dramatically until Q4 2021 or Q1 2022.
The market could be about to top in the very long term after these developments, as we had a massive rally in oil, and a rapid surge in global credit creation since the pandemic lows. Govts and Central Banks have been easing, keeping real interest rates below the natural rate of interest while providing stimulus aiding people until an economic recovery took place.
We are just now slowly going back to normal, but the economic recovery is yet to reach levels adequate for the easing to stop. All the stimulus and credit creation paired with supply chain issues due to lock downs has led to a period of higher inflation expectations, driven mainly by a tremendous rally in commodities, which seems to be over by now. There is an interesting pattern where the global credit impulse chart leads changes in bond yields with a 10 month time lag and/or industrial commodities returns by about 8 months (as noted by Alfonso Peccatiello, author of 'The Macro Compass' substack). The data shows it peaked in Q4 2020, which, forward 8 months, gives us a peak in April-June for commodities and by Q4 2021 for bond yields to move (and likely affect risk assets overall). This possibly will match the time required for data to give the Federal Reserve confidence to taper and accelerate the pace of interest rate hikes, faster than the market potentially expects.
My mentor, @timwest had pointed out that big rallies or declines in oil precede bottoms or tops in equities with a 6 month lag, this metric also fits the idea of a top by EOY.
Refer to his publication in related ideas for more info on that pattern, it's extremely interesting, as it gives actionable key levels for long term analysis.
See related ideas for my long term forecast for Nasdaq, which fits this macro framework as well, potentially predicting a long term rally culminating by Q4 2021 or Q1 2022. This same pattern is present in mega cap names like $AAPL and $AMZN, and visible in $SPY charts as well.
After the current growth rally, we might get a period where there is a dollar shortage in the Eurodollar market, and everything goes risk off, except for $DXY.
We need to be prepared to mitigate its effect or even profit from it, but also don't miss the current huge rally that is starting now.
This will likely happen after real interest rates surpass natural observed interest rates, triggering a broad risk asset selloff and deleveraging.
What has happened historically is that after long term trends end in major stock indices, we enter a period where commodities outperform stocks, this is likely to occur after the initial shock recedes. Might be the time to revisit my long term $XAGUSD idea.
Cheers,
Ivan Labrie.
References:
www.richmondfed.org
www.treasury.gov
themacrocompass.substack.com
www.macromarketsdaily.com


VUG / VTVGrowth vs Value.
I believe Growth companies will correct to possibly 50 SMA and bounce up and down...until it progresses upward.
Any thought?


VUG 59% profit on 2nd COVID-19 market dropLong -term investment idea for ETF AMEX:VUG on potential 2nd COVID-19 market drop.
VUG 59% profit / Long trade 127.20 -> 202.00 / TrailStop 37.4 of price amount
Profit: 59%, Risk: 29.5%, Risk ratio = 1/2
Allocation: 25% of the portfolio
All equities from our ideas was fundamentally checked and have good ratios (P/E, Debt/Equity, Sales past 5Y, Profit Margin) together with strong long-term up trends.
Stay tuned with more ideas and market signals with our Telegram-bot.


$VUG indicators bullish | Possible run up to 160's$VUG
Seeks to track the performance of the CRSP US Large Cap Growth Index.
Provides a convenient way to match the performance of many of the nation’s largest growth stocks.
Follows a passively managed, full-replication approach.
investor.vanguard.com
