Utility stocks are due for a short term bounceA beautiful, self explainatory chart. I have started a long position based on this weekly trendline (orange) being hit with high velocity, expecting a decent bounce.
Disclaimer : Educational idea only. Not a financial advice. Consult your CFA for financial advice.
XLU trade ideas

$XLU potential bearish reversal on the Quarterly chart$XLU is showing a potential 2-2 reversal to the downside on the quarterly chart.
Because of this, I will try to find actionable signals on Utility stocks.

XLU bearish hammer near all time highWe are at all time highs with XLU, should've entered at long day bearish candle pull back, but clearing this bearish hammer and locking all this buyers is good enough with me. Not much in our way till MA 100.

Utilities as a hedge are overThe overly optimistic approach to choose utilities as the recession hedge didn't have too much grounds. Profits are falling, recession is priced in. Sector is not going much higher before coming back to reality

XLU $XLU Initial LongXLU $XLU Initial Long. This is a pure momentum signal just as are every other signal I post. ZERO other factors are considered in producing this signal.
Entry reasons: XLU is showing momentum and confluence of mean reversion crossing up the 70 day price mean.
Exits and SL: TP and SL on chart. Move SL on TP. After TP2, trail with 0.5xATR step and 1.5xATR offset.

XLU forming evening star reversal on dailyXLU can go down wave C if completes evening star reversal pattern. Will monitor closely.

Inverse Head and Shoulder - Entry ConfirmationLast week I presented this inverse head and shoulders.
Chances seemed bleak that it would play out the way I outlined in this idea.
But here we are.
Neckline completed with the help of a double bottom forming at the base of the last shoulder.
Winter is drawing near.
Water problems in Mississippi, No problem, print another couple billion more dollars.
Not many safe places to park money right now.

Utilities Signal test of All Time HighsIt's always about power.
Utilities are eyeing all time highs.
With this mornings sell off, XLU formed an inverse head and shoulders.
The 162% profit target for the structure lines up perfectly with an Ascending Triangle forming on the daily and all time highs.
Smash the Boost if you like these ideas.
Follow for more unique content and art!

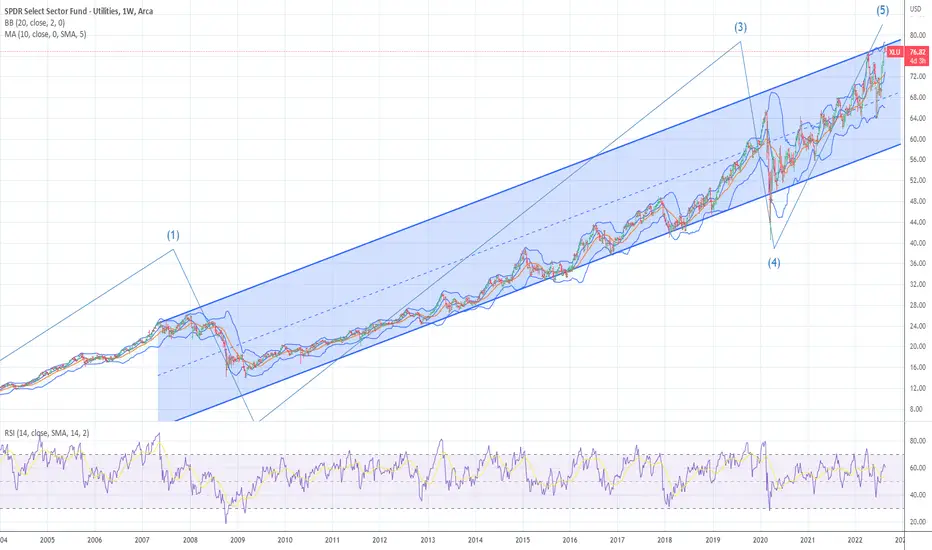
COMING END of the BULL MARKET in the XLU We have ended Wave 4 of major wave 5 of 5 o5 long term scale see channel long term This would mean and confirm that the 40 year Bull market in US debt is going to have some major issues . If I were a long term holder I would raise a stop and sell calls as well . this trend looks like and END is near

XLU bearish swing?First bull candle closing below the 10 ema. XLU made a new all time high. Attempting to sell high, buy low.

XLU INFLATION vs DEFLATION game set match it is OVER OCT is going to be like a raging storm or forest fire . run as far as you can there is No place to Hide outside of Cash and the US $ . 90% plus of investor and above 90 % of TRADERS have not lived thru a BEAR MARKET BUT THEY WILL The FED MANDATE as to inflation the spread is at 600 basis they will be happy if they can get it to 200 and Unemployment is easy to go to 5.5 to 6.5 by spring . They stopped the printing on sept 2 2021

$XLU - Great Entry Price if Channel HoldsAMEX:XLU
If price can holds within this channel, looks like a great entry price. Will need to monitor price compared to the overall market to gain confidence the sector will be resilient, but there's potential.

Utility Stocks Broke Out. Now They’re Pulling Back.Utilities are one of the few parts of the market to hit new highs recently. Now, after a pullback, some dip buyers may get interested in the sector.
This chart of the SPDR Utility ETF highlights the $71.10 level where prices peaked in February 2020. XLU was stuck below its old highs throughout the pandemic, and only broke out in March 2022. It’s now pulling back toward that level. Will old resistance become new support?
Second, the 50-day simple moving average (SMA) is rising from below. Will it also provide support? (As an interesting side note, TradeStation data shows that only three of 11 sector funds closed above their 50-day SMAs yesterday. Consumer Staples and REITs were the other two.)
Third, XLU’s stochastic indicator has slipped into oversold territory.
Finally, it’s interesting that the recent strength in utilities has occurred after the broader market corrected. That suggests utilities are serving their traditional role as safe havens .
TradeStation has, for decades, advanced the trading industry, providing access to stocks, options, futures and cryptocurrencies. See our Overview for more.
Important Information
TradeStation Securities, Inc., TradeStation Crypto, Inc., and TradeStation Technologies, Inc. are each wholly owned subsidiaries of TradeStation Group, Inc., all operating, and providing products and services, under the TradeStation brand and trademark. You Can Trade, Inc. is also a wholly owned subsidiary of TradeStation Group, Inc., operating under its own brand and trademarks. TradeStation Crypto, Inc. offers to self-directed investors and traders cryptocurrency brokerage services. It is neither licensed with the SEC or the CFTC nor is it a Member of NFA. When applying for, or purchasing, accounts, subscriptions, products, and services, it is important that you know which company you will be dealing with. Please click here for further important information explaining what this means.
This content is for informational and educational purposes only. This is not a recommendation regarding any investment or investment strategy. Any opinions expressed herein are those of the author and do not represent the views or opinions of TradeStation or any of its affiliates.
Investing involves risks. Past performance, whether actual or indicated by historical tests of strategies, is no guarantee of future performance or success. There is a possibility that you may sustain a loss equal to or greater than your entire investment regardless of which asset class you trade (equities, options, futures, or digital assets); therefore, you should not invest or risk money that you cannot afford to lose. Before trading any asset class, first read the relevant risk disclosure statements on the Important Documents page, found here: www.tradestation.com .

Utilities have received too much attentionMassive debt and great share of fuel in expenses can't justify this run. XLU back under resistance

4/24/22 XLUSPDR Select Sector Fund - Utilities ( AMEX:XLU )
Sector: Miscellaneous (Investment Trusts/Mutual Funds)
Market Capitalization: $ --
Current Price: $74.25
Breakout price: $77.20
Buy Zone (Top/Bottom Range): $74.05-$71.25
Price Target: $76.60-$77.30 (1st), $82.60-$84.10 (2nd)
Estimated Duration to Target: 24-25d (1st), 109-114d (2nd)
Contract of Interest: $XLU 5/20/22 75c, $XLU 12/16/22 75c
Trade price as of publish date: $1.72/contract, $4.50/contract

Will XLU continue to push forward?XLU looking to repeat itself. Will it continue forward? looking for a break above.

Market trendsThe market has gone through so many trend cycles in the past few years. Sometimes trends last a few days, weeks, months or even years. Clearly the 2022 trend so far has been Energy, Commodities & Utilities. What do you think the next trend is and how long do these trends last? Drop a line with your ideas. Here's a 3-split chart of XLU, XLE & COMT, 15m, 1hr & 4hr charts.
Do your own due diligence, your risk is 100% your responsibility. This is for educational and entertainment purposes only. You win some or you learn some. Consider being charitable with some of your profit to help humankind. Good luck and happy trading friends...
*3x lucky 7s of trading*
7pt Trading compass:
Price action, entry/exit
Volume average/direction
Trend, patterns, momentum
Newsworthy current events
Revenue
Earnings
Balance sheet
7 Common mistakes:
+5% portfolio trades, capital risk management
Beware of analyst's motives
Emotions & Opinions
FOMO : bad timing, the market is ruthless, be shrewd
Lack of planning & discipline
Forgetting restraint
Obdurate repetitive errors, no adaptation
7 Important tools:
Trading View app!, Brokerage UI
Accurate indicators & settings
Wide screen monitor/s
Trading log (pencil & graph paper)
Big, organized desk
Reading books, playing chess
Sorted watch-list
Checkout my indicators:
Fibonacci VIP - volume
Fibonacci MA7 - price
pi RSI - trend momentum
TTC - trend channel
AlertiT - notification
tickerTracker - MFI Oscillator
www.tradingview.com

XLU Bullish Flag BreakoutXLU formed a bullish flag pattern after breaking out of a descending trendline recently
Price has broken and closed above the flag which is the resistance on 15 March
Long 700 shares at 71. 01
Stop loss will be previous pivot low

Utilities vs SPYThe sector showing RS vs broader market. Several names on my scan too.
See XLU having bottomed vs SPY and now breaking to upside of 10-month base.

Utilities struggling with high energy pricesLast time I underestimated oil and gas prices as a cost for utilities. For now dont see any significant downturn there. Labour cost doesnt help as well

CypherI have noted many are seeking out utilities for a bit of stability.
XLU is an ETF slammed packed with utilities. It is a product of the SPDR ETFs.
Cypher which has the 2nd leg retracement pull between the .382 and the ,618 This one appears to have pulled to the ,618. Labeled XABCD and stop is below D somewhere. Peak 2 is higher than peak 1.
This could be safer than individual utility stocks and the dividend is good. Little more reach for the .786 of XC which is where the cypher lands. Patience is a virtue.
No recommendation.
Gap noted on XA which could serve as support.
Yield is 3.18%
Top 10 Holdings
NextEra Energy Inc
18.15%
Duke Energy Corp
7.99%
Southern Co
7.20%
Dominion Energy Inc
6.30%
Exelon Corp
5.60%
American Electric Power Co Inc
4.44%
Sempra Energy
4.19%
Xcel Energy Inc
3.61%
American Water Works Co Inc
3.40%
Public Service Enterprise Group Inc

December to date sector performanceXLU = Utilities +5.27%
IYR = Real Estate +3.10%
IYT = Transportation +1.57%
XLF = Financial +1.51%
XLC = Communication +1.19%
XLK = Technology -0.32%
IBB = Biotechnology 0%
XLE = Energy -0.59%
SMH = Semiconductor -3.17%
XRT = Retail -6.15%
Do your own due diligence, your risk is 100% your responsibility. This is for educational and entertainment purposes only. You win some or you learn some. Consider being charitable with some of your profit to help humankind. Good luck and happy trading friends...
*3x lucky 7s of trading*
7pt Trading compass:
Price action, entry/exit
Volume average/direction
Trend, patterns, momentum
Newsworthy current events
Revenue
Earnings
Balance sheet
7 Common mistakes:
+5% portfolio trades, capital risk management
Beware of analyst's motives
Emotions & Opinions
FOMO : bad timing
Lack of planning & discipline
Forgetting restraint
Obdurate repetitive errors, no adaptation
7 Important tools:
Trading View app!, Brokerage UI
Accurate indicators & settings
Wide screen monitor/s
Trading log (pencil & graph paper)
Big, organized desk
Reading books, playing chess
Sorted watch-list
Checkout my indicators:
Fibonacci VIP - volume
Fibonacci MA7 - price
pi RSI - trend momentum
TTC - trend channel
AlertiT - notification
www.tradingview.com
