Aptos APT is ready to take off!Hello, Skyrexians!
Yesterday we considered ADA analysis and today the price of this asset started moving up and surged +14% in less than one day. Hope you were able to make a right decision. Today we will take a look at BINANCE:APTUSDT - another one interesting cryptocurrency with the great potential in the bull market.
On the chart you can see the weekly time frame for Aptos. Technically it is printing the global 2 year sideways. As you know, the sideways movement can be the accumulation or distribution. We suppose that it's accumulation before the mark up phase. Elliott waves analysis gives us the clear answer. We consider the early growth as the impulsive wave 1, after that APT is in flat correction, the wave 2, which consists of zigzag ABC. Look how perfectly wave C collected liquidity below the wave's A bottom and started going up.
Let's also notice the green dot which has been flashed by Bullish/Bearish Bars Indicator . It's is showing us the potential reversal points. Take a look how great it worker previous 2 times, indicated wave's A bottom and wave's B top. Now there is a high probability that it was the global bottom before the expansion to the upside.
The while line of the indicator showing the local support, if price is able to maintain above it, usually it leads to impulse. If our analysis is correct the wave 3 is incoming. We can calculate the targets using Fibonacci extension levels. The minimal one is $42, max target is $64.
Best regards,
Skyrexio Team
___________________________________________________________
Please, boost this article and subscribe our page if you like analysis!
APTUSDT.PS trade ideas

Aptos Last Chance, 2nd Entry PREMIUM 6X SHORT—251% PotentialIs it luck, good timing or experience?
There is a saying in the trading world, "the market always gives a second chance." This is the second and also the last chance.
I wanted to share the full trade-numbers for the Aptos (APTUSDT) SHORT but was a bit late, it was moving already but, guess what? The market produced the classic bounce and we have the chance to enter again, a 2nd entry.
The chart setup is self-explanatory.
The early August/late October move was an inverted correction, after this move is over, the resumption of the initial bearish move (March 2024) should take place. The next low will set the 2024 correction bottom. We profit from the wave down and the wave up.
Just as I am sharing bearish signals now, I will be sharing LONG when the market turns. I hope to be able to count with your continued support.
Full PREMIUM trade-numbers below:
____
SHORT APTUSDT
Leverage: 6X
Entry levels:
1) $10.4
2) $9.35
Targets:
1) $8.88
2) $8.35
3) $7.65
4) $6.95
5) $6.32
6) $5.55
Stop-loss:
Adjust to your own risk tolerance
Potential profits: 251%
Capital allocation: 3%
____
Thanks a lot for sharing.
Leveraged trading is super high risk and should not be approached by beginners. Liquidation can result in the loss of funds. This is not financial advice.
I think this is another one that will do great.
Patience is key.
Thank you for reading.
Namaste.


APTUSDTBINANCE:APTUSDT
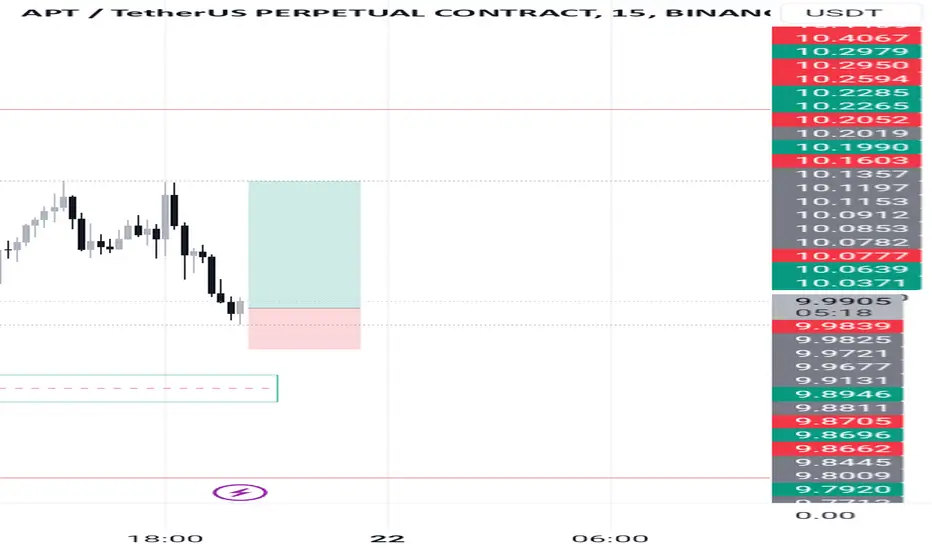
APTUSDT we have a reversal in the downtrend, and the key level has been broken and tested twice
If we close above the key level with a daily candle I expect we’ll move towards the supply zone If we break through the supply zone we're likely moving to $13 and then to $15
Trade carefully
this is just the technical side
Keep an eye on the news

APTUSDT Trading Signal: Time to BuyBased on current market analysis and the EASY Quantum Ai strategy, we recommend a Buy position for the APTUSDT currency pair. This recommendation is driven by several key factors indicating a potential upward trend.
Enter Price: 8.06
Take Profit: 8.36666667
Stop Loss: 7.74666667
The strategy utilizes advanced algorithms to assess market dynamics like momentum, volume, and support levels. Recent analysis shows positive market sentiment and increased buying pressure for APTUSDT, suggesting a favorable moment for entering the market.
The Easy Quantum Ai strategy has identified that recent price consolidations near potential support levels provide a springboard for upward movement. Additionally, the moving averages indicate that APTUSDT is on the verge of entering a bullish phase, with potential cross points suggesting an upcoming price increase.
Furthermore, recent macroeconomic indicators reflect stability and growth in related sectors, which tends to positively impact APTUSDT. Such factors add weight to our current buy recommendation.
Stay alert and consider these limits when positioning your trades. Remember that market conditions can change rapidly, so monitor ongoing developments closely. This signal aligns with the robust analysis rendered by our EASY Quantum Ai strategy, but as always, ensure you manage risk appropriately.

Loud and Clear! Bullish Megaphone on APT 4hThis is a classic bullish Megaphone pattern on APT. Kinda feels like buying the top but all of the hallmarks are there, most notably the 5 waves, bullish entry, rising volume. I'm placing low margin longs and hoping to see a breakout to the upside when BTC breaks out of a bullish descending wedge pattern it is in on the 4h chart.
I'm still overall bearish on crypto for the longer term well into next year, but these patterns this morning are to clear not to enter swing trades.

Aptos: Correction Is Not Over, 40% Drop Followed By Bull-MarketThe lower high is in and APTUSDT (Aptos) has been bearish for 13 days, but the correction isn't likely over. The fact that a strong lower high was produced on 22-October vs 26-March signals that this pair is likely to hit a new low or lower low.
The minimum drop with the current chart structure and price dynamics would be a test of the 5-August low, which would be around -40%. It can go even lower on a wick but this wouldn't change the fact that a strong recovery will follow as soon as the bottom is in. So not all is bad news.
It will crash moving down strong and fast but then it will recover strong and fast also. While the final "leg-down" will only take a few days to unravel, maybe a few weeks, the proceeding bull-market can go for 8-12 months.
So we are looking at 2-3 weeks red, maximum, followed by almost an entire year of sustained growth.
That's a good deal if you ask me.
Thanks a lot for your continued support.
Namaste.


APTUSDT Trade setupreaching to correction point. As we see the momentum we execute the plan in both ways cheers!

APTOS LONGI anticipate a correction in Aptos after its significant pump,It appears to be rejecting the daily bearish order block as well.

APT LONGI'm in a long position, hoping for a price increase to the daily fair value gap, but targeting the daily high

APT, I Don't like the structure but call!Actually, I just don't like this kind of chart structure, but opportunity is still an opportunity.
There are some smart money movements for several days and keep pushing the price higher and higher.
The oscillator divergence is the confirmation to enter the trade.
Call: current price, and still valid if the price still below 9.6600
SL: 7.9307
TP 1: 12.4580 (Exit 25%, and change the SL into Entry Price)
TP 2: 14.1873 (Exit another 25%)
TP 3: 15.9166 (Exit the rest 50%)

Aptos #AptScalping Aptos with a quick short trade; exiting after profit. Trend uncertain, but likely upward

I Can’t Stress Enough: Buy APT Now!APT is one of the most promising assets in the current market, and missing this opportunity could cost you in the long run. Here’s why you need to act fast:
1-Strong Fundamentals: APT is backed by a solid project with innovative technology and a growing ecosystem.
2-Bullish Trend: The chart shows a steady uptrend with higher highs, signaling strong buying momentum. 📈
3-Market Sentiment: Institutional investors are starting to show interest this is a sign of big moves coming. 🚀
4-Potential Breakout Zone: It’s near a key resistance level, and once it breaks through, we could see a major price surge.
5-Favorable News Cycle: Positive updates about APT’s development and partnerships are expected soon.
Don’t wait until it’s too late buy APT now and position yourself to profit from the next rally. Timing is everything in this market!

APT Short📈 Current Price and Trend:
The chart shows that APTUSDT is trading around $9.12.
A bullish trend started from a strong support level, as marked with the annotation "Start Latest bull-trend". The price has moved upwards within a channel, breaking through previous resistance levels.
🔄 Pullback to Breakeven:
A pullback to the breakeven zone (highlighted in red) around $9.57 - $9.97 is seen, which may act as a key resistance area if the price attempts to rise again.
🎯 Take Profit Targets (TP):
TP-1: $9.18 📌 – This level might be a short-term resistance where partial profit can be considered.
TP-2: $8.83 📉 – Another potential target within a downward trend.
TP-3: $8.30 📉 – This level aligns with the next support, where a significant pullback could happen.
📊 Key Support and Resistance:
Resistance: Near $10.73, marked by the upper trendline, and also around $9.57 - $9.97 (breakeven pullback zone).
Support: The next strong support level is around $7.49, where a trend reversal could occur if the price drops.
⚠️ Recommendation:
Long Position: Consider entry if the price holds above the breakeven zone with targets at TP-1, TP-2, and TP-3.
Short Position: If the price fails to hold above the breakeven zone, aiming for lower targets around $8.83 and $8.30 could be prudent.
This analysis combines key price levels, potential take-profits, and possible resistance and support zones as per the channel and trendlines shown.

aptI am not very optimistic about the first line, although there is a good support, but the lower order can be more reliable
Aptos Mid-Size Correction UpdateHere we can see how APTUSDT (Aptos) already produced the last and final jump. Each time a wave reaches its end there tends to be one final shakeout, a strong wick or something unusual to complete the move.
Here this happened with a long upper wick 22-October, after this date, we start to see lower right away. We can see volume rising and declining and we know the drop is in.
How far down can it go?
The wick in August produced a price lower than the support range that was activated in October 2023, but the session closed ended up higher. Seeing that we have more than two months of consolidation on that support level and the strong reversal in August, it is likely that this level can hold on the next drop. If the mark is really weak it can break but this would require several challenges of support. Since we are expecting a fast drop, this is likely our low.
It also depends on how active traders become; leverage, buyers and so on. If too many people buy too fast, the bots might adapt and continue to sell. If people re-enter the trade slowly, the pair can recover right away.
Regardless of how things go, we are expecting only one strong final drop before the market turns.
All is good. We know what to expect so we can prepare.
Thank you for reading.
Namaste.

APT USDT- MUST WATCH THIS ANALYSISIf price rejects from the FVG, Then we can watch the below support level and the imbalance of the market, And RSI shows bearish divergence.

Aptos | APT vs SUIThe price of Aptos is $10.7 today with a 24hour trading volume of 128 million dollar. This represents a 7% price increase in the last 24 hours and a 6% price increase in the past 7 days
With a circulating supply of 190 Million APT, and YES we back to 2 billion dollar Marketcap. now lets compare SUI and APTOS
Both Aptos and Sui blockchains are designed to address the scalability and efficiency issues faced by the current generation of blockchain networks. They both implement one of the most advanced programming languages – Move, utilize parallel execution for high throughput, and offer low latency. These similarities make them attractive options for businesses looking to build blockchain-based applications. The language used for parallel execution in both Aptos and Sui is Move, which is based on Rust and was initially designed at Meta. The language offers powerful tools and features to build smart contracts and decentralized applications. However, Sui has its own version of the language.
Aptos follows the standard design outlined in Diem’s whitepaper, while Sui has a slightly different object model. Sui’s storage system is object-centric, which means that most things on the blockchain, including addresses and transactions, are represented as objects.Sui’s version of Move clearly indicates when an object is owned, shared, mutable, or immutable, whereas Aptos does not. Additionally, Sui’s ownership API is cleaner than Aptos’s, as it provides a clearer representation of the blockchain design
Sui and Aptos differ significantly in their architecture, particularly in how they utilize distributed ledger technology. Sui’s ledger is stored as a directed a cyclic graph rather than a blockchain like Aptos. While both designs are efficient and share similarities with traditional blockchains, their differences are essential to their consensus mechanism and scalability.aptos has a modular architecture that enables easy upgrades and customizations, while Sui focuses on a multi-layered architecture to separate the consensus, storage, and computation layers. This allows for improved scalability and flexibility in the network.The ecosystems are very different and extensive in both projects. Every day there is something new to discover at both chains. It’s hard to pick out an outsider and a favorite. Aptos blockchain got its popularity before Sui, but at the moment, judging by the number of followers on Discord, Sui is overtaking Aptos.
After a surge in the popularity of Aptos several months ago, many various projects were created and launched exactly using that blockchain. During the year 2022, over 100 projects were developed using Aptos network.the most popular projects built over Aptos include Pontem (a universal wallet) and Pyth (a modern oracle). Aptos boasts a growing ecosystem of tools, libraries, and developer resources, while Sui’s ecosystem is relatively nascent but has the potential to grow rapidly as more developers join the network.as for Sui, the mainnet of the network will only be launched in Q2 2023 and the testnet was launched in the last days of March 2023. Thus, the majority of the project is now TBA. One of the most remarkable Sui projects so far is Sui wallet. Still, the Sui blockchain has great potential to overtake Aptos due to its scalability level.
Aptos and Sui are two blockchain ecosystems with different approaches to their tokenomics. Aptos has released an overview of their tokenomics for their native token APT, but additional information is expected to be published soon. APT is currently used for PoS participation and liquidity incentives, with an initial supply of 1 billion tokens. The majority of the initial supply is currently staked for PoS participation, with the remaining tokens allocated to different categories.
On the other hand, Mysten Labs has published an in-depth whitepaper on the native token of Sui, SUI. SUI will be staked within an epoch to participate in the proof-of-stake mechanism and on-chain voting. Additionally, SUI will be used as the asset denomination to pay for gas fees and other operations on the Sui platform, with a total supply of 10 billion tokens. The exact allocation percentages for the distribution of tokens have not been released, but the presence of the storage fund can create monetary dynamics and reduce the amount of SUI in circulation.
In conclusion, both Aptos and Sui have their unique selling points and hold great potential for businesses looking to adopt blockchain technology. However, Sui and Aptos are rapidly developing ecosystems, they’re still pretty ‘young’ compared to other big players in the industry. Thus, they are definitely expected to settle all security audit issues soon.

#APT\USDT#APT
The price is moving in a descending channel on the 1-hour frame upwards and is expected to continue.
We have a trend to stabilize above the moving average 100 again.
We have a downtrend on the RSI indicator that supports the rise by breaking it upwards.
We have a support area at the lower limit of the channel at a price of 9.70.
Entry price 9.80.
First target 10.19.
Second target 10.50.
Third target 10.88.