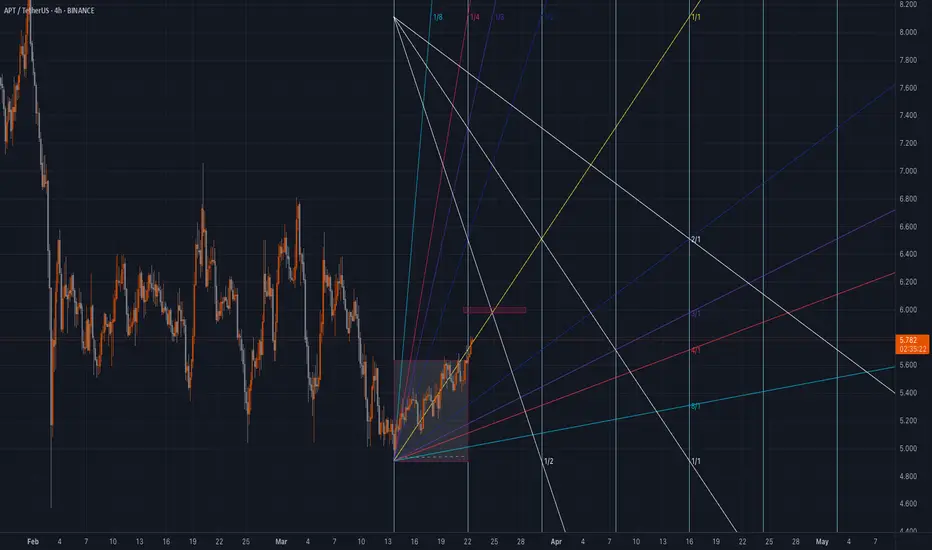
Aptos long to $4.9 Tonight!EURONEXT:APTOS long.
DTT method applied.
Almost 4RR potential
3.-3.86RR (edited)
APTUSDT.PS trade ideas

APTUSDT 4DAPT ~ 4D Analysis
#APT Buy back when testing this support with a short -term target of at least 20%+ from here.

Apt may fall further.Very difficult days are ahead for Apt.
* The purpose of my graphic drawings is purely educational.
* What i write here is not an investment advice. Please do your own research before investing in any asset.
* Never take my personal opinions as investment advice, you may lose your money.

APTThe currency has completed the five corrective waves and now begins to rise to the third wave, which is the longest.

APT Way Down For Long LiqudationsAptos recently hunted lots of short positions during last crash. In February 2 most of the assets crashed a lot. And there is still remaining liquidity and imbalances within the last long wick.
APT has formed a bearish flag in it's consolidation rectangle. It's headed trough 4.5$.
Thanks for reading.

TradeCityPro | APTUSDT The Beginning of a New Downtrend!👋 Welcome to TradeCityPro Channel!
Let's go back to the day when Trump imposed tariffs on the United States again, causing stocks and cryptocurrencies to fall and gold to rise. Let's take a look at our attractive altcoin chart
🌐 Overview Bitcoin
Before starting the analysis, I want to remind you again that we moved the Bitcoin analysis section from the analysis section to a separate analysis at your request, so that we can discuss the status of Bitcoin in more detail every day and analyze its charts and dominances together.
This is the general analysis of Bitcoin dominance, which we promised you in the analysis to analyze separately and analyze it for you in longer time frames.
📊 Weekly Timeframe
APT remains inside its large, volatile range, frequently bouncing between its highs and lows. However, this time, it has formed a lower high, which is not a positive sign.
Additionally, after breaking $7.78, sellers completely engulfed the weekly candle, and for the past five weeks, all candles have been red with high selling volume, confirming the downtrend.
There is no buy trigger at the moment, and I cannot recommend a buying opportunity until the market forms a new structure.
For selling, if APT drops below $4.97, it makes sense to exit and accept the loss instead of holding onto a losing position.
📉 Daily Time Frame
In the daily time frame, the power is in the hands of the sellers! After the parabolic line broke, we experienced a Sharpe decline, accompanied by the formation of a lower ceiling and floor, which has continued our downward trend.
The parabolic movement itself is a very rapid and bullish movement, and every time the price hits it, it quickly returns to its trend and is supported, but when this line is broken, that trend is practically over and we suffer, or we experience a Sharpe decline like this chart!
After the drop and the formation of a box between 5.136 and 6.491, the selling force was clearly evident in this space, because the last time we moved towards the ceiling of 6.491, we could not reach this ceiling and we were rejected earlier.
This rejection made us return to this support faster with a number of red candles, unlike the previous attempt where we moved up with a larger number of candles. Yesterday's daily candle also engulfed the previous 3 candles and is exactly ready to break 5.136.
If today's daily candle closes in the same way, the probability of a drop in the coming days will increase and increase. If you are a holder of this coin, it is logical to sell and after returning to the box and breaking its ceiling, buy with the same number of Tethers and reduce the probability of a drop and loss of capital for yourself!
✍️ Final Thoughts
Stay level headed, trade with precision, and let’s capitalize on the market’s top opportunities!
This is our analysis, not financial advice always do your own research.
What do you think? Share your ideas below and pass this along to friends! ❤️

#APT/USDT#APT
The price is moving within a descending channel on the 1-hour frame and is expected to continue upward.
We have a trend to stabilize above the 100 moving average once again.
We have a downtrend on the RSI indicator, supporting the upward move with a breakout.
We have a support area at the lower boundary of the channel at 5.20.
Entry price: 5.41
First target: 5.46
Second target: 5.58
Third target: 5.70

Aptos 3rd wave coming soonAptos 3rd wave coming soon - i think APTOS is a good trade now - look at this perfect entry for the 3rd wave.

#APT/USDT#APT
The price is moving within a descending channel on the 1-hour frame and is expected to continue lower.
We have a trend to stabilize below the 100 moving average once again.
We have a downtrend on the RSI indicator, supporting the upward move with a break above it.
We have a resistance area at the upper limit of the channel at 5.43.
Entry price: 5.32
First target: 5.28
Second target: 5.21
Third target: 5.10

APT 3D Trade Journal - pt I3D Timeframe Update: APTUSDT – Structural and Trend Analysis
March 27, 2025
This update focuses on the structural and trending environments of APTUSDT on the 3D timeframe, laying the foundation for deeper correlations (volatility, volume, momentum) as the bottoming process evolves.
The goal is to provide a clear, actionable framework while maintaining a disciplined approach to key inflection points.
Structural Analysis: Range Dynamics
From a range perspective, APTUSDT is framed by key levels derived from previous yearly lows, highs, and EQ (adjusted to Range Low, Range High, and Midrange for broader context):
Range High (PYH): $19 – Key resistance, repeatedly capping upward moves.
Midrange (PYEQ): $11.9 – Neutral zone, acting as a pivot.
Range Low (PYL): $4.9 – Critical support, currently retested.
Demand Zone: $3–$4 – A high-probability reversal area below the Range Low.
Notably, the majority of trading activity has occurred between the Range Low and Midrange, with only brief, unsustainable periods above the Midrange.
This suggests a strong gravitational pull toward the lower half of the range, reflecting a market dominated by selling pressure and limited bullish conviction. To enhance granularity, an intermediary level market 1/2 (PYL → PYEQ) at $8.4 has been added, providing a secondary pivot within the lower range.
A critical observation, deviations below the Range Low have historically triggered significant expansions. The Demand Zone, therefore, represents a high-probability area for accumulation, likely to attract strong buying interest and catalyze the next major leg up if tested.
Trend Analysis: 12 & 25 EMA Dynamics
The 12-period and 25-period Exponential Moving Averages (EMAs) provide a clean lens for identifying bull and bear phases on the 3D timeframe.
Historical bear periods (e.g., April–October 2023 and April–September 2024) reveal a consistent pattern: price repeatedly attempted to reclaim the EMA bands but was rejected each time, with no daily close above the bands during downtrends.
This underscores the EMAs’ reliability as a dynamic resistance during bearish phases.
Currently, the price is at $5.8, testing the lower EMA band after a sustained downtrend. The 12 EMA remains well below the 25 EMA, with a wide separation between the bands, confirming the ongoing bearish trend.
While the price appears to be forming a base near the Range Low (a potential recovery signal) caution is warranted.
Previous bear periods lasted approximately 150 days, whereas the current bear phase is only 81 days.
Although time-based correlations are not definitive, this suggests the bottoming process may not be complete, especially given the persistent downward trend and lack of bullish confirmation.
Key Levels and Scenarios to Watch
To shift to a bullish bias, the following conditions must be met:
Price Action: Price must test the $6.7–$7.6 area (aligned with the weekly 12 & 25 EMAs) multiple times, demonstrating sustained buying interest.
EMA Compression: The 12 & 25 EMAs should compress (narrowing the gap) before a bullish crossover, signaling a potential trend shift.
Breakout Confirmation: A violent break above the EMA bands, followed by a 12/25 EMA crossover and price expansion to the upside, would mark a structural trend reversal.
Conversely, a rejection from the $6.7–$7.6 area could drive the price below the Range Low, targeting the Demand Zone. Such a move (mirroring the July 20–August 4, 2024 move) would present the optimal buying opportunity.
A strong reaction from the Demand Zone, coupled with a break above the EMA bands, would likely initiate the next bullish leg.
Next Steps and Recommendations
While the current base formation near the Range Low is a first step, it lacks the subtlety required for aggressive positioning, so patience is critical.
Over the coming updates, we will integrate momentum via oscillators, volatility and volume analysis to cross-check trend shifts as the price approaches key levels.
For now, I will:
Monitor: Price reaction at the Range Low and the $6.7–$7.6 area over the next 1–2 3D candles.
Avoid: Random trades based solely on the base structure, as the trend remains bearish.
Prepare: For a potential test of the Demand Zone, which could trigger significant volatility and liquidity adjustments.
This disciplined approach ensures we capture the structural shift at the right moment, maximizing opportunities for strategic positioning.
From now on, every trade I take will be broken down here. Thought process, strategy, and lessons learned. A permanent record of my evolution as a trader, set in stone. Or glued to my profile :)

Will APTUSDT Bounce or Break? Last Chance for the Bulls?BINANCE:APTUSDT.P
🚨 APTUSDT is sitting at a crucial level. After multiple CHoCH and BoS signals, price has dumped into the key Demand Zone (PDL) . Now it’s either a spring up or a deeper dump to the next liquidity zone.
📌 Technical Outlook:
CHoCH → BoS → Liquidity Grab: Clear bearish structure.
Equilibrium broken: Bulls failed to hold control.
Now: Price is testing the blue Demand Zone (PDL) with big orders possibly resting.
🎯 Trade Plan:
Scenario 1: Long from support zone
Entry: bounce from 5.45–5.50 USDT
Stop-Loss: under wick low at <5.38 USDT
Take-Profits:
TP1: 5.70 USDT
TP2: 5.90 USDT (Equilibrium zone)
TP3: 6.00–6.15 USDT (Imbalance + Premium zone)
Scenario 2: Short after PDL breakdown
Entry: break and retest below 5.45 USDT
Stop-Loss: above 5.55 USDT
Targets:
TP1: 5.20 USDT
TP2: 5.00 USDT
📊 Confluence Factors:
Volume spike = buyer activity
Local CHoCH inside zone = reversal signal
Strong impulse down may sweep liquidity
💬 Final Thought:
APT is at a pressure point — it’s spring or capitulation. Clear setup, no tilt.

APTThe currency has completed the second wave according to the clear pattern on the chart and will now ascend to the third wave. According to Fibonacci measurements, the target is at $80.

#APTUSDT red line The previous two moves that started after the red resistance line broke have brought good profits to buyers.
This time we should wait for the red resistance line to break, which may break from these points or kiss the green support band and then attack the red line.
So we wait for the line to break and watch.

AptusdtHello friends, it's Amir.**
The analysis of **APT/USDT** on the weekly timeframe is ready for a **buy** trade. We just need **volume confirmation** and a **clear RSI crossover**. In this case, a **scaled entry** seems good to me. What’s your opinion?

#APT/USDT
#APT
The price is moving within a descending channel on the 1-hour frame, adhering well to it, and is heading for a strong breakout and retest.
We are experiencing a rebound from the lower boundary of the descending channel, which is support at 5.45.
We are experiencing a downtrend on the RSI indicator that is about to break and retest, supporting the upward trend.
We are looking for stability above the 100 Moving Average.
Entry price: 5.45
First target: 5.55
Second target: 5.66
Third target: 5.80

$APT setupAMEX:APT just tapped into the weekly FVG without taking out prior lows—setting up a solid risk/reward for mid-term targets. If bulls keep momentum, next weekly levels could be in play. Eyes on how we close this week!
That same pattern is popping up across many #altcoins, often leading to 150–300% moves. Keep scanning those charts—opportunities are out there if you recognize and trade the setup confidently!

Enter APTUSDT buy Enter APT now market price stop loss 4 hour candles close under the Yellow line tp is the small box
APT/USDT Aptos is a scalable layer-1 blockchain built with Move language. It offers new and novel innovations in consensus, smart contract design, system security, performance, and decentralization. The combination of these technologies will provide a fundamental building block to bring web3 to the masse


TradeCityPro | APTUSDT Market Drop on Trump News?👋 Welcome to the TradeCityPro channel!
Let's analyze and review one of the popular tier-2 coins together and take a look at this recent Trump news regarding the economic record
🌐 Overview Bitcoin
Before starting the analysis, I want to remind you again that we moved the Bitcoin analysis section from the analysis section to a separate analysis at your request, so that we can discuss the status of Bitcoin in more detail every day and analyze its charts and dominances together.
This is the general analysis of Bitcoin dominance, which we promised you in the analysis to analyze separately and analyze it for you in longer time frames.
📊 Weekly Timeframe
APT remains inside its large, volatile range, frequently bouncing between its highs and lows. However, this time, it has formed a lower high, which is not a positive sign.
Additionally, after breaking $7.78, sellers completely engulfed the weekly candle, and for the past five weeks, all candles have been red with high selling volume, confirming the downtrend.
There is no buy trigger at the moment, and I cannot recommend a buying opportunity until the market forms a new structure.
For selling, if APT drops below $4.97, it makes sense to exit and accept the loss instead of holding onto a losing position.
📈 Daily Timeframe
On the daily timeframe, APT failed to break the $14.61 resistance. Even worse, it couldn't even reach the previous high before getting rejected earlier, signaling weakness.
After breaking below $8.46, the market entered an MWC (Market Weakness Confirmation) downtrend.
Following the breakdown, a pullback retest occurred, and the daily candle engulfed the previous two days' candles, leading to further decline. Currently, APT is at $5.70, with RSI in the oversold zone, suggesting a possible short-term slowdown in selling pressure.
I personally feel that APT’s drop is sufficient for now, and we might enter a range here before a final move toward the $4.95 support. However, this does not mean it’s a buy signal. We need to wait for a new market structure before considering spot entries.
In the current situation, the market is really not very analytical and Bitcoin is likely to hit the $72,000-$74,000 level and then go for a break or bullishness, and you should pay attention to these market times! Don’t be FOMO!
📝 Final Thoughts
Stay calm, trade wisely, and let's capture the market's best opportunities!
This analysis reflects our opinions and is not financial advice.
Share your thoughts in the comments, and don’t forget to share this analysis with your friends! ❤️

Aptos ($APT) Bullish Signal and ETF PotentialAptos (APT) is currently exhibiting a descending wedge pattern on the daily chart, characterized by converging trendlines that slope downward, typically signaling a potential bullish reversal upon breakout. Concurrently, Bitwise Asset Management has submitted an S-1 registration statement to the U.S. Securities and Exchange Commission (SEC) to launch an exchange-traded fund (ETF) tracking APT. This regulatory filing underscores growing institutional interest in the asset and could enhance liquidity, market exposure, and investor confidence if approved.
From a technical perspective, the Relative Strength Index (RSI) on the daily timeframe has formed a bullish divergence, with the price establishing lower lows while the RSI (14-period) prints higher lows. This discrepancy suggests weakening bearish momentum and strengthens the likelihood of a price reversal. Collectively, these factors position APT for a potential resurgence towards recent resistance levels, aligning with the projected breakout from the wedge pattern.
The combination of favorable technical indicators and the prospect of ETF-driven capital inflows presents a constructive outlook for APT in the near term.
Alex Kostenich,
Horban Brothers.


#APT/USDT#APT
The price is moving in a descending channel on the 1-hour frame and is adhering to it well and is heading to break it strongly upwards and retest it
We have a bounce from the lower limit of the descending channel, this support is at a price of 5.74
We have a downtrend on the RSI indicator that is about to break and retest, which supports the rise
We have a trend to stabilize above the Moving Average 100
Entry price 5.94
First target 6.076
Second target 6.27
Third target 6.48
