APTUSDT.PS trade ideas

#OP/USDT#OP
The downtrend channel was broken strongly with a strong daily candle on a 1-day frame
The broken trend was retested
We also have an upward trend on the RSI indicator
We also have a higher stability moving average of 100
Entry price 9.31
The first goal is 9.67
Second goal 10.47
Third goal 11.17

Aptos $12.20 ➥ $20.00 - $125.00Aptos $12.20 ➥ $20.00 - $125.00
Take profit - $20.00 (10%)
Take profit - $27.50 (10%)
Take profit - $29.00 (10%)
Take profit - $36.00 (10%)
Take profit - $50.00 (10%)
Take profit - $60.00 (10%)
Take profit - $70.00 (10%)
Take profit - $90.00 (30%)

APTUSDT Long IdeaBINANCE:APTUSDT has recently done break out on one day time frame and we still haven't got any retest of the support which I believe has a less chance as majority of the traders are very bullish on this coin and the dips are filling quickly but if we get the chance the black box is the area to enter

APT 15 min TImeframe TradeThe rejection on the 15-minute timeframe OB in Apt could potentially cause a price increase.
APT/USDT Keep an eye on the support, If bounce APT will back UP!💎APT has recently shown significant market dynamics. Currently, APT is facing rejection after testing the Bearish OB zone and is now retesting the support area around 10.85 to generate new momentum for a breakout.
💎 If APT successfully breaks above the supply area, its probability could signal a continuation of the upward movement, potentially leading to reaching our target area.
💎 However, if APT fails to maintain the support area and breaks below it, the next critical level is the Bullish OB area. APT must bounce from this area, as failure to do so could result in losing the support trendline.
💎 If this occurs, APT may switch back to a downward trajectory, continuing further downward movement.

APTOS (Y24.P1.E1).Support level to go longHi traders,
We have 2 levels of interest. if it dips to the 0.5, its a buy otherwise I see this nPOC holding it up on the 0.382 fib.
I also has MAs coming up ... refer to some screen shots.
All the best,
S.SAri

APT/USDT Perfect Bounce, Ready for continue Upward Move!💎 APT has been drawing significant attention in the market with its recent performance. It has recently made a noteworthy bounce from a demand zone, underscored by the closure of the daily candle with a robust green indicator.
💎 Should this bounce prove to be a reliable signal, APT might well be on its path to an upward trajectory, probability aiming for the targeted bearish OB area.
💎 However, if APT fails to maintain its upward momentum and revisits the demand area, it will be crucial for it to hold and rebound from this level.
💎 Failure to do so could indicate a break in the bullish trend. In such a scenario, there's a potential for APT to embark on a downward journey, moving towards the support area and possibly extending further to a lower, more robust support zone. The market's response in these key areas will be critical in determining APT's future direction.


APT/USDT Potential Uptick from Key Demand Zone? 🚀APT💎 Paradisers, gear up for a thrilling trade with #APTUSDT, now finding its footing at an essential demand zone, signaling a possible market move.
💎 Diving into #APTOS latest moves, it's apparent that it fell short of breaking past its previous high, stirring up bearish vibes. Yet, a bullish shift seems on the horizon from the demand level of $9.3298. With momentum on our side, we're eyeing a climb capable of surpassing the looming resistance.
💎 Should momentum for AMEX:APT begin to fade, a bullish revival from the solid support at $7.8646 is what we're looking out for. However, dipping below this critical level may indeed mark a transition towards a deeper bearish phase

APT pumping WITH OI increasingAPT pumping WITH OI increasing
Follow the trend after some range or pullback take entry for LONG

APT/USDT: APT Trade EntryWe are considering a scenario of the beginning of APT purchases.
Since the beginning of the second half of October, the asset has been demonstrating an upward trend, starting from the price level of $4.7926 and reaching $11.0934. This growth amounted to over 130%.
At the moment, APT is undergoing a correction and is trading around the inclined resistance level. The POC volume level is also close to this resistance level.
We are entering a trade on APT with the expectation of growth to the price level of $11.0934, which is more than 16%. Upon reaching this price, we plan to partially close the position, leaving it open in case of buyer activity and positive market sentiment.
Then we will hold the position until the next target at the price level of $12.9259.

APTOS/USDT #APTIn my opinion, Aptos is experiencing excessive growth and requires correction. Therefore, I am recommending a short position on it.
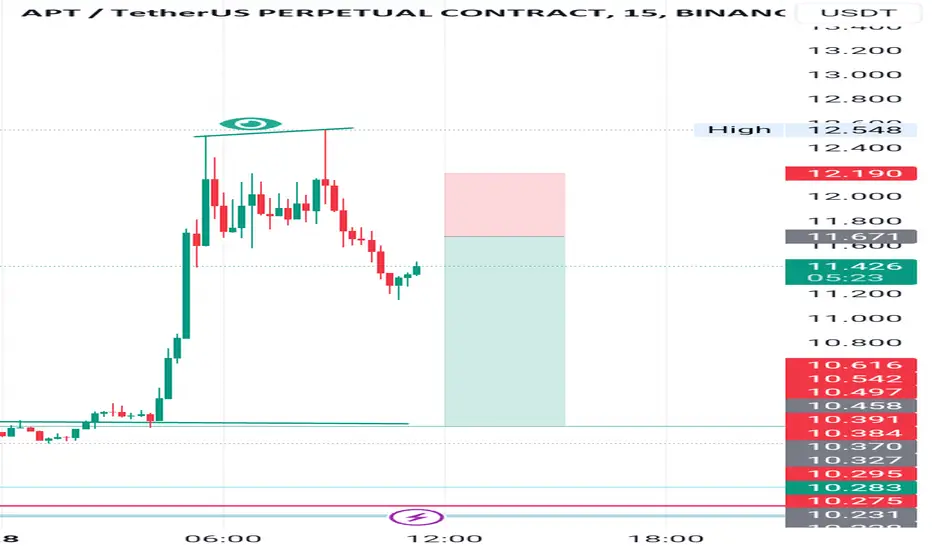

Aptos correction incoming ?Aptos reached the same highs on the 4-hour chart, which may result in a rapid decline on the 15-minute chart.
Aptos short👀 Many altcoins are experiencing a significant correction due to the pullback in Bitcoin. This could indicate either a minor correction or potentially trigger a sell-off at this price.

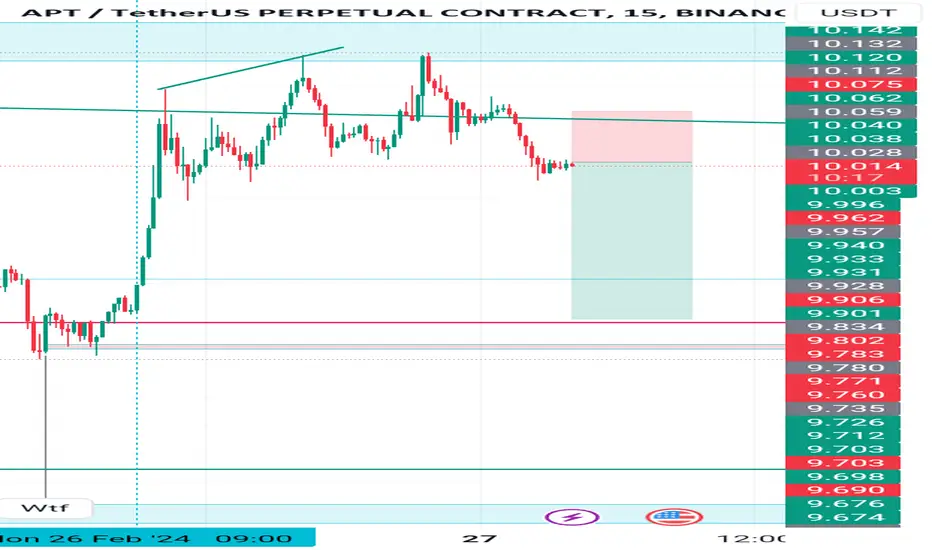
AptI have a position in Aptos, as the coin has broken out from the trendline and now aims to test the resistance zone.


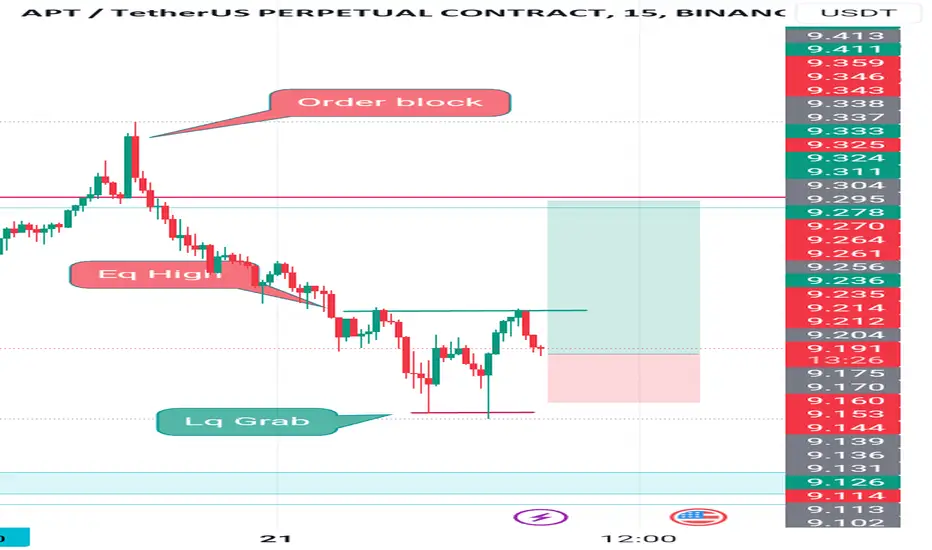
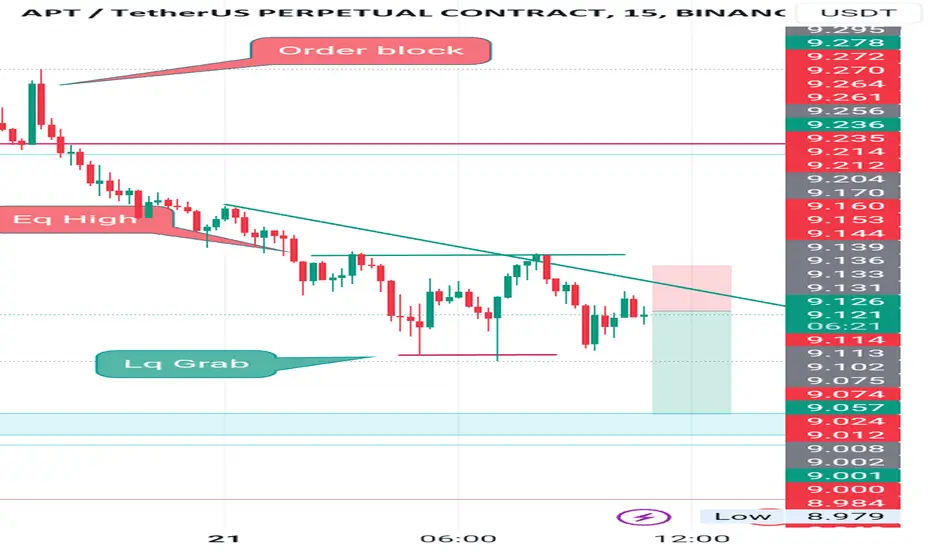
APT The "APT" coin is forming a "W" pattern and finding support from a significant trend line. Additionally, it has triggered a stop hunt in the current order block.

APT - LOCAL DEAL (FEBRUARY)Stop-Loss (x5 shoulder):
$8.36 (If triggered, the loss will be -25% of the position)
Take Profit (x5 leverage), we close 50% of the position in each value:
$11.84
$13.75
Note:
After the first take, we move the stop to the price of $9.34.

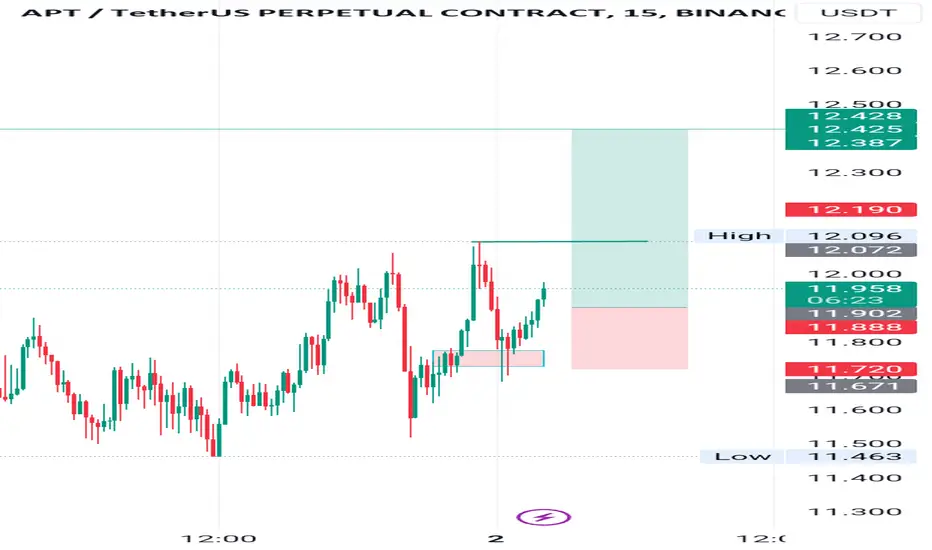
Aptos #scalping I have a long position on Aptos, as I believe that the previous resistance has now become a support level.
Aptos > Look first then excuteI am currently watching another play that suggests bearishness with lower highs and lower lows. This may result in a price decrease, although there is a possibility that I could be mistaken.
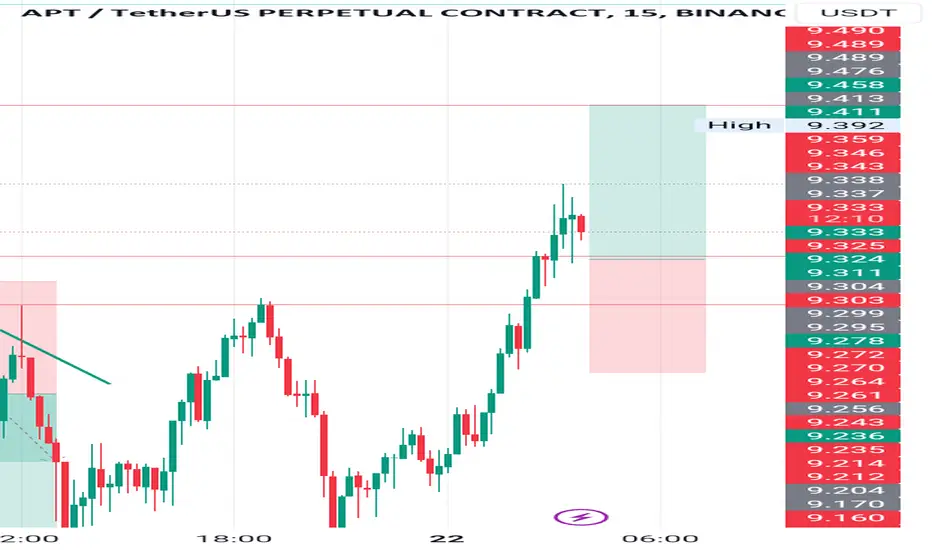
Apt long Long traders were enticed by the market sweep, which rapidly acquired liquidity. I am taking a long position because, in my opinion, it is currently safe.