Reverse in 4 level*-Technical Analysis 📈
4 movement mesuremoving at level break
*Trade (Buy/) 📊
7.03$
*-Stop Loss 🔴
6.64$
*-Take Profit 🎯
7.79 - 8.54 $
*-Risk Management 🚧
3%
👨🎓 Experience and Education: Our trading team has five years of experience in financial markets, especially cryptocurrencie
APTUSDT.PS trade ideas

APT/USDT 1D. Aptos secondary trend. Channel.Aptos/usdt secondary and local trends.
In the secondary trend we can observe the downtrend channel. Right now the price is moving in the upper part of this channel. Stayin' near the resistance of this channel.
We've had an attempt to break this channel on aug 9, but it went unsuccessful. Retracted to the support at 4.9$(13).
Bounced from the middle of this downtrend channel. We've been in this downtrend channel for more than 180 days as for now.
Above we have the resistance of 7$. If/when the price breaks it - it goes back to the horizontal channel. If price gets above 7$ level(zone) - which previously acted as support for this big channel - then the potential to the middle(12$) and the resistance of the channel is opened(20.4$).
For this to happen, it's also necessary to break out the downtrend current channel, i believe it's obvious.
If we don't break the resistance of the channel - then first support is 4.9$(4.8) zone again. Then in will be 4.4$ and then the support of the channel at about 3.6$ zone.
Everything is shown on the chart.


APT - This time it's time for you to say goodbyeThere is a high probability that APT will start a new trend as the price rises above balance. let's watch

APT/USDTAMEX:APT
huge resistance with the green horizontal line, but that can also turn into huge support once this cup and handle pattern plays out!
target $9.60

APTUSDT.1DBased on the market data provided, the APT cryptocurrency is currently trading at 7.3304 USDT.
On the 4-hour chart, the Relative Strength Index (RSI) is at 53.21, which indicates a nearly balanced market with almost equal buying and selling pressure. The Moving Average Convergence Divergence (MACD) is at 0.0722, suggesting a slightly bullish market. The Bollinger Bands (BB) are at 7.66, indicating a moderate level of market volatility. The support levels are at 7.0308, 6.73, and 6.50, while the resistance levels are at 7.619, 8.12, and 8.30.
On the daily chart, the RSI is at 70.02, suggesting that the market is nearing overbought conditions and could potentially see a price pullback. The MACD is at 0.44, indicating a bullish market. The BB is at 7.619, suggesting moderate volatility. The support levels are at 6.84, 6.35, and 5.73, while the resistance levels are at 7.99, 8.29, and 8.89.
On the 7-day chart, the RSI is at 43.80, indicating a slightly bearish market. The MACD is at -0.54, suggesting a bearish market. The BB is at 8.050, suggesting a higher level of volatility. The support levels are at 6.63, 6.24, and 5.38, while the resistance levels are at 8.40, 9.38, and 9.69.
In conclusion, the market appears to be bullish in the short term but is nearing overbought conditions on the daily chart, which could lead to a price pullback. In the longer term, the market appears to be bearish. Therefore, careful monitoring of market conditions is advised for potential entry and exit points. As always, this analysis should be combined with further research and potentially seeking advice from a financial advisor.

APTOS: Is It Going to Dump from Here?This is my analysis on BINANCE:APTUSDT
Technically;
- The bulls are looking weak
- Bearish PA
- Bearish candle formation
- Resistance level (even this is weak)
Fundamentally;
- There is unlock schedule in next 3 days, and the unlocked coins is 10% of entire APT mcap. This will likely create sell pressure on APT in the open market.
What are your thounghts about my analysis? Share them with me in the comment box.
If this analysis makes sense to you, follow me now and support my idea.
Cheers!

APTUSDT Elliott Waves Analysis (midterm)Hello friends.
Please support my work by clicking the LIKE button👍(If you liked). Also i will appreciate for ur activity. Thank you!
Everything on the chart.
After correction will looking for new long position.
Entry: 6.3 - 5.8
Targets: 8.3 and ~9
after first target reached move ur stop to breakeven
Stop: ~5 (depending of ur risk). ALWAYS follow ur RM .
RR: 1 to 3
risk is justified
Good luck everyone!
Follow me on TRADINGView, if you don't want to miss my next analysis or signals.
It's not financial advice.
Dont Forget, always make your own research before to trade my ideas!
Open to any questions and suggestions


APT has a bullish signal!
🎗#APT/USDT 🎗
LONG
Leverage: (10.0X)
Entry Targets:
1) 7.32
2) 7.15
Take Profit Targets:
1) 7.55
2) 7.83
3) 8.08
4) 8.38
5) 8.66
6) 8.93
7) 9.20
8) 9.50
Stop Targets:
1) 6.34
🟡Chart is speaking it self!
_ _ _ _ _ _ _ _ _ _ _ _ _ _ _ _ _ _ _ _ _ _ _ _ _ _ _ _ _ _ _ _ _
Thank you for seeing idea .
Have a nice day and Good luck
🔴This is only an idea and not a financial advise ( NFA )🔴
SasanSeifi 💁♂APT ⏩ 8$ / 8.70$Hey there! In the daily time frame, the expectation we can have is that the price may grow to the range of 8 dollars. The significant support range is at 6.50 dollars. 📈🚀
🟢 Keep in mind that these are just scenarios, and it's important to conduct your own analysis and consider other factors before making any trading decisions 😊📈📉
❌ (DYOR)
⭕Of course, if you have any more inquiries or require further clarification, don't hesitate to reach out. I'm here to assist you!
🔹If you found this analysis helpful, please show your support by liking and commenting. Thank you! 🚀😊 🙌

#APT/USDT is testing the resistance zone in 4-Hour TF!#APT/USDT is testing the resistance zone in 4-Hour TF!
AMEX:APT needs to clear the PMH $7.45 resistance level to gain the bullish momentum. Wait for Breakout to open a long position.
Wait for PDL and trendline breakdown to short it.

APT - on the rise with great momentumAPT proved trendline break and now it's getting resistance at Kijun 3D.
A close above 11 is what I want to see for maximum bullish momentum.
I think it can easily reach 17 if that will happen and you also have all targets for now.

short APTshort APT 4h,
checkcheckcheckcheckcheckcheckcheckcheckcheckcheckcheckcheckcheckcheckcheckcheckcheckcheckcheckcheckcheckcheckcheckcheckcheckcheckcheckcheckcheckcheckcheckcheckcheckcheckcheckcheckcheckcheckcheckcheckcheckcheckcheckcheckcheckcheckcheckcheckcheckcheckcheckcheckcheckcheck

APTUSDTA rather short picture emerges in this asset, let’s look at it. First, let's look at the local downward trend (it also acts as resistance), which formed after the upward trend was broken down. We tested it a couple of times, but we never saw any penetration.

APTUSDT.Pmy entry on this trade idea is taken from a point of interest below an inducement.. I extended my stoploss area to cover for the whole swing as price can target the liquidity there before going as i anticipate.. same idea Ive always been using.. just a trade idea, not financial advise

APT/USDT looking for further drop! Hey traders 👋
APT coin did caught our attention as well here with a nice potential for a further drop to happen. Are we ready for another 40% drop on APT coin? What do you think guys!
If you like ideas provided by our team you can show us your support by liking and commenting.
Yours Sincerely,
Swallow Team
Disclamer:
We are not financial advisors. The content that we share on this website are for educational purposes and are our own personal opinions.

AptosHad a read about this greatly hyped new L1 recently and can see how it can become a competitor in the alt L1 race quite easily tbh
Other alt L1s starting to pump here also tbh
Think it won't take too many candles to retest aths after the initial hype sell-off tbh
'This is where you buy' part of the cycle right here..

APT 50$✌🏻Hello, friends! Today I want to share my thoughts with you about a young and promising project - APTOS (APT). This coin has already gained significant attention due to its successful drop and is attracting the interest of many investors ahead of its anticipated second distribution.
👆APTOS is a project that was launched in October 2022, and in this short period, it has gained recognition thanks to its team, which is constantly working on its development. The project is led by two charismatic developers - Mo Sheikh (President and CEO) and Avery Ching (Technical Director, who previously worked at Yahoo). They already have experience working on Mark Zuckerberg's promising project called Diem.
🔥After being listed on the Binance exchange, APT showed an impressive 500% growth, indicating that major players are already investing in this project. After a correction, the coin is again showing movement and preparing for new goals.
👉The project's tokenomics has its peculiarities, including regular lock-ups and only 25% of coins in circulation with a capitalization of 1.5 billion. However, considering that similar projects with their own blockchain can reach a capitalization of 50 billion, the coin's price could soar to an impressive $100. But perhaps a realistic goal is a price of $50, which also looks very attractive.
Let this project delight us, and we will watch its development together. Happy investing, friends!

APTUSDTAPTUSDT is consolidating in between this falling wedge on Daily Timeframe. Longis only valid after retest of resistance as a support.Expecting big move from this in next coming days or weeks.Must keep it on your watchlist.

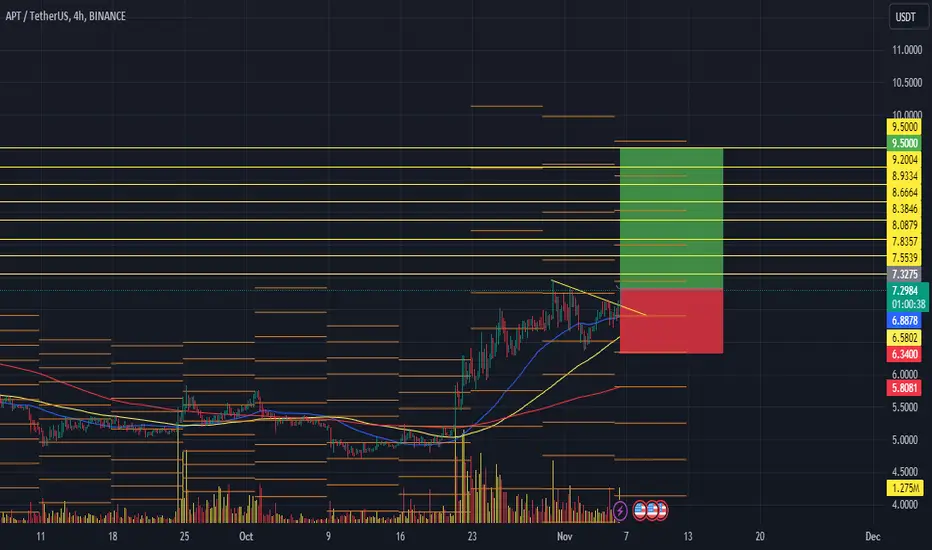
APT has a bullish signal!
🎗#APT/USDT 🎗
LONG
Leverage: (10.0X)
Entry Targets:
1) 6.76
2) 6.70
Take Profit Targets:
1) 7.02
2) 7.22
3) 7.39
4) 7.56
5) 7.75
6) 7.95
7) 8.15
8) 8.40
Stop Targets:
1) 5.84
🟡Chart is speaking it self!
_ _ _ _ _ _ _ _ _ _ _ _ _ _ _ _ _ _ _ _ _ _ _ _ _ _ _ _ _ _ _ _ _
Thank you for seeing idea .
Have a nice day and Good luck
🔴This is only an idea and not a financial advise ( NFA )🔴

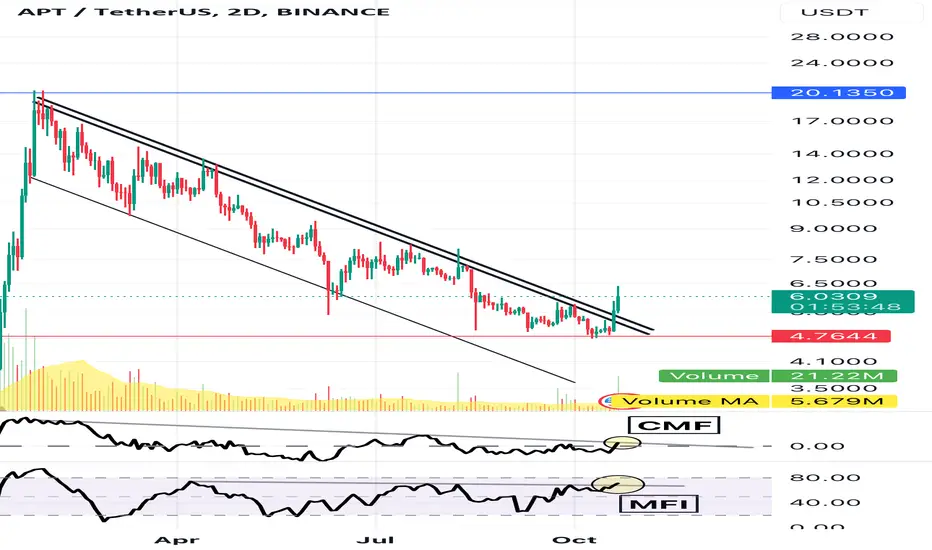
APT good for spot I missed the good entry of APT, for a low TF trade (see link below). However, in 2D TF, clear break-outs of both price and volume actions (CMF & MFI) can be seen.
I bought spot APT at this price and target the previous high (around $20).
Will APTOS repeat the scenario of TON?Hello everyone! The situation with APTOS is very similar to the situation I recently published about the TON cryptocurrency.
The asset is currently at a local bottom, which serves as a good support zone.
If Bitcoin doesn't drop below its current levels (which is expected), then after breaking out of the local accumulation zone, there will definitely be growth.
The growth will also be supported by breaking through the descending trendline. Therefore, it is important for the asset to establish itself above it.
Targets are shown on the chart.
This is not a financial recommendation, everything you do is at your own risk.
