APTUSDT.P Trading IdeaHi everyone,
Currently I see possible scenario like this:
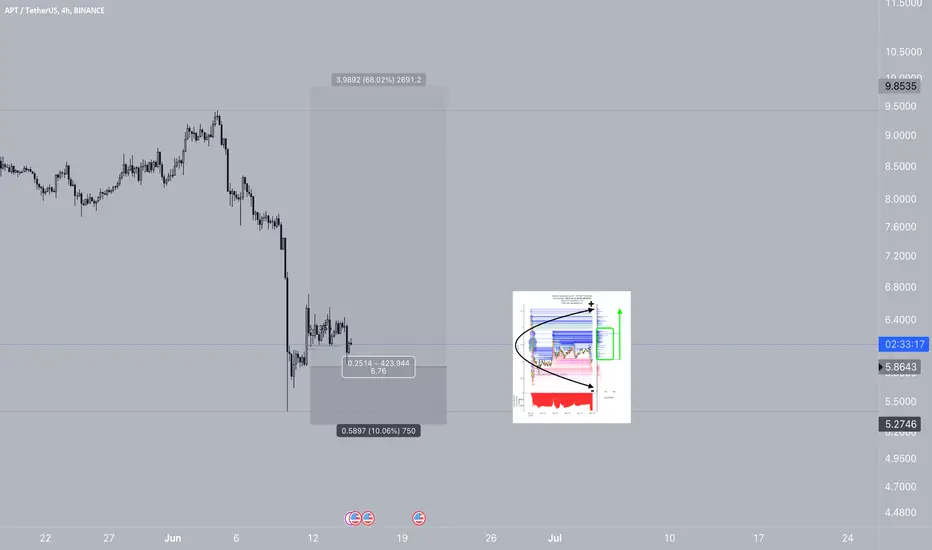
- leave current range
- correction to STB area at the bottom side
- then price reverse
The STB worked with internal liquidity, and it should be strong enough to prevent price going down.
Above we have an IMB 4H, which was tested, but the IMB FF, might be our first FTA.
APTUSDT.PS trade ideas

Aptos bullish no signs of stopping? 👀 🚀APT Today Analysis💎APT is on the brink of a breakout from the descending channel, with a noticeable 'V' pattern forming within the channel. A successful breakout could trigger a significant bullish surge.
💎Another crucial factor is that APT is trading in a high-demand area, which could amplify the bullish momentum.
💎The volume is also demonstrating notable upward spikes, which is an important factor that cannot be overlooked.
💎There's an area of invalidation where if the price loses its bullish momentum and breaks down from this area, it could lead to a bearish move.
💎In the dynamic world of crypto, staying informed and adaptable is key. Stay tuned for more updates and enjoy your trading journey

APTUSDTThis is my opinion with technical analysis
Please respect the following rules:
1- Risk management .
2. Have your own strategy.

Aptos APTUSDT Price Analysis (12h)Hello dear trading community!
Our previous analysis predicted a drop to the 0.382 Fibonacci retracement zone, which was achieved at approximately $6.30. Now, Aptos has rebounded from this target and is showing signs of a potential Elliott wave formation and opening up new possibilities for the cryptocurrency.
Currently, Aptos is approaching the resistance level of a downtrend channel, indicating the potential formation of an Elliott wave pattern. This could mark the completion of Elliott wave (1) within a new cycle for Aptos. Elliott wave theory suggests that after a completed impulse wave (1), a corrective wave (2) is likely to occur with estimated support level zone near $6.50.
Based on our analysis, we anticipate that Aptos will make a rebound near the resistance level to complete the corrective wave (2). This would align with the principles of Elliott wave theory, where wave (2) typically retraces a portion of the gains made in wave (1). Once the corrective wave (2) is complete, Aptos is poised to resume its uptrend with targets above $10.00!
As always, it is important to closely monitor the price action and validate our analysis with further developments in the market.

APT Aptos Bullish TrendlineAPT (Aptos) currently exhibits a bullish trend continuation pattern, suggesting a potential upward movement in the near term. The price action indicates that the stock has been experiencing consistent buying pressure, indicating positive market sentiment and potential for further price appreciation.
Considering the bullish trend continuation, it is reasonable to set a price target of $8.80 for APT. This target represents the projected upside that could be achieved if the bullish trend persists.
Looking forward to read your opinion about it!


APT Long Idea Apt Bullish Bat Pattern seems to be ready for reversing, recommended to use only 1% of your Portfolio on Spot. Target profit 66%, Stop Lots -17%. This is only an Idea, remember to always manage calculate your risk before enter in a trade. Fell free to share your thoughts :)

APTApt technical analysis basically on elliott waves Principles and Priceaction Strategys
Apt can be touch the levels that i point
Wait and watch.

APTOS. Has the APTUSDT price reached the bottom? When to buy?If we assume that the APTUSDT price has reached its bottom, falling to the first and only liquidity level from below - $5.50, we can experiment with wave analysis.
Most likely, the APT price movement is skillfully managed by trading bots. How else to explain the beautiful and rapid growth earlier, and the long and protracted correction, but exactly within the channel last few months?)
We have depicted the waves diagrammatically, because each wave needs to be recalculated as it grows.
However, if the bottom of the second wave has already been reached, then we can assume that the peak (3) of the wave may fall in the $60-80 price range.
Therefore, if you believe in the bright future of the Aptos project, or you are a medium and long-term investor in the cryptocurrency market, or even consider yourself to be in the first and second categories at the same time, then the $6-7 buying zone is for you)
Then wait a few months and fix x10 - easy money)
Of course, this is all theory; in practice, everyone makes trading decisions on their own and is personally responsible for their own deposit.
_____________________
Did you like our analysis? Leave a comment, like, and follow to get more

APTUSDTThere is an overbought RSI as well as a strong resistance where I expect the price to decline. This deal has a high win rate.


#apt long RR +-7 r i s k yThis is a somewhat more risky trade since the stop can be turned to a 4h candle close as the chart indicates, which we are talking about possible traps, but beyond that if Btc really fulfills this as its support we should see good squeezes .
Its in the middle of the range, no confirmation for a deviationright now price in the middle of shoot up
no confirmation for the price is making a deviation or just want to push price higher
if pull back and enter the range its a clear short position ,
if push higher to a new range them its a better clear short position
either way its a short but at which level
all of it depends on price action sir.

APT - Interesting chartAPT losing its weekly support?
pl = potential long
ps = potential short
Let’s see what happens in the coming weeks

apt Looks ready to reclaim 20$Seems like ready To reclaim 20$ in midterm Overall moving in descending Channel & approaching towards horizontal resistance once both got cleared midterm term target would be 20$ trade according your strategy


APTOS: Bullish Flag Pattern Detected Continuation to $20!Hello, Traders! Today, I want to share an exciting technical analysis finding on Aptos (APTOS). A bullish flag pattern has been identified, indicating the potential for a continuation of the previous uptrend, with a target of $20. Let's dive into the details!
📈 Ticker: APTOS
📅 Timeframe: Daily Chart
📊 Pattern: Bullish Flag
📉 Understanding the Bullish Flag Pattern:
A bullish flag pattern is a continuation pattern that typically forms after a strong upward price movement. It consists of a flagpole (the initial sharp rise) followed by a consolidation phase in the form of a rectangular flag. This pattern suggests that the market is taking a brief pause before resuming the upward momentum.
🔍 Identifying the Bullish Flag on APTOS:
Upon analyzing the daily chart of APTOS, the following observations come to light:
1️⃣ Strong Uptrend: APTOS has experienced a notable upward price movement.
2️⃣ Rectangular Flag: A consolidation phase formed with parallel trendlines, resembling a flag, following the initial rally.
3️⃣ Decreasing Volume: The trading volume during the consolidation phase has declined, indicating a potential temporary lull in market activity.
📈 Price Targets and Trading Strategy:
If the bullish flag pattern on APTOS plays out as expected, it suggests a potential continuation of the previous uptrend. Consider the following revised price targets:
1️⃣ Target 1: Resistance level near $15.00
2️⃣ Target 2: Potential breakout towards the next resistance level near $18.00
3️⃣ Target 3: Extended move towards the top of the bull flag near $20.00
🛡️ Risk Management:
Managing risk is crucial for successful trading. Implement the following risk management techniques:
1️⃣ Set a stop-loss order below the lower boundary of the flag pattern to protect against unexpected price reversals.
2️⃣ Adjust position size based on your risk tolerance and overall portfolio management strategy.
🔔 Conclusion:
Keep a close eye on Aptos (APTOS) as it exhibits a bullish flag pattern, indicating the potential for a continuation of the previous uptrend. The revised price targets suggest potential resistance levels at $15.00, $18.00, and an extended move towards the top of the bull flag at $20.00. However, please note that technical analysis is not infallible, and market conditions can change rapidly. Combine this analysis with other relevant factors and fundamental research before making any trading decisions.
Disclaimer: This post is for informational purposes only and should not be considered financial advice. Always conduct your own research and consult with a qualified financial professional before making investment decisions.
Happy Trading! 📈💰
#tradingview #technicalanalysis #bullishflagpattern #APTOS #continuationpattern #tradingstrategies #investing #finance #marketanalysis

APTUSDTAPT does not have a good situation and has even lost the downward trend channel. However, fortunately, it has been supported by the support line that many people were waiting for. But from here, we have to wait to see if this support can cause the price to rise again or if this support will also be lost.
The price of $5.50 can be a good point for buying, but I want to wait and see which direction the market will take.
⚠️ "Daily crypto market analyses I provide are personal opinions & not financial advice. Trading carries risks, so do your own research & seek advisor's help."

APT USDT APT has not lost the level of the channel and there is a very nice hope with technical analysis to see it align with the path of the channel.
Contact with the bottom of the channel was logarithmic well. And seeing it ascending on the fractal ..

APT good ideaAPTOS has been in a correction since the end of January 2023.
Buy zone: 6$ - 5$ - 4$
Better 5-4$
mid-term target: 20 $
long-term target: 50 $ and higher

SUI VS AtopsFriends, hello everyone! I noticed an interesting similarity between two assets - SUI and Atop. After the decline, both assets experienced approximately a 70% loss. However, if we look at APT, we can observe an intriguing pattern - it showed a decline, followed by a minor correction, a final impulse (where the best entry point was), and a 400% increase.
Now, as SUI has undergone a decline, we are observing a slight correction, after which we expect a final impulse and further growth.
It's fascinating to see what will happen with these assets going forward! Let's keep an eye out for updates.

APTOS (Y23.P2.E1).Macro outlookHi Traders,
This is my thoughts on #APT based on fibonacci and Elliot wave theory.
I have created a YT post explaining my approach if your interested further.
Please give me a like and share, and comments, would be good to engage.
Please don't ask me prices as the chart gives you the range and hence you could work it out yourself.
All the best,
S.SAri

APTUSDT - When to buy? (NEW)APTOS has been in a correction since the end of January 2023.
Buy zone: 9$ - 7,50$
9$ is a golden pocket (0.618 fib level)
mid-term target: 18,50$ - 20 $
long-term target: 50 $ and higher
If support fails, next buy levels to DCA in for a long run are 5,33$ and 4 $ .
Possible scenarios are shown on the chart.
Good luck!
