APTUSDT.PS trade ideas

APT - potential 2x - 3x profit📉 The token is currently trading at a significant discount, partly due to the resignation of their CEO, Mo Shaikh, and partly because of the overall altcoin slump during the Christmas and New Year holidays.
🌟 However, the token has great potential, and above the $19 level, there’s unrealized short liquidity. It’s logical to assume the price will move upward to claim it.
💡 Entering a long position in parts with a tight stop-loss and a risk-reward ratio of 1:10 is a sensible strategy right now.
So, the Signal:
🔹 APTUSDT - Long
📥 Entry: $8.5 - $9.5
🎯 Target 1: $18.9
🎯 Target 2: $28.5
🛑 Stop-loss: $7.75
🚀 Let’s aim for those targets!

AptusApt usdt Daily analysis
Time frame 4hours
Risk rewards ratio >1.8 👈👌
Technical analysis 👇
After a correction, ApTuS is gathering energy to start an upward movement.🕰🕰
The price has fallen to the gray uptrend line.
This gray line, which acts as a support, as well as another support level marked in dark blue on the chart, have created very strong support.
According to Elliott Wave Analysis, the three-point Elliott wave pattern has ended and we are now ready to start the impulse waves.
The volume chart gives us signs that an accumulation is forming in this area.
We conclude that, considering the three factors mentioned above,
1. The price is in a strong support area,
2. The Elliott wave correction has ended, and 3. Volume chart shows an accumulation area
👇👇👇👇
Based on this, we conclude that the right point and time for a price will increase and good Risk rewards ratio ~2 for traders 👌


TradeCityPro | APT: Daily Trend Breaks and Bottom Forming👋 Welcome to TradeCityPro!
In this analysis, I will examine the APT coin, the primary coin of the APTOS network, which is one of Ethereum's second-layer networks. This analysis will be conducted in the daily timeframe.
📅 Daily Timeframe: Breaking the Curved Trend Line and the First Bearish Leg In the daily timeframe, we are witnessing a strong upward trend that started from the $4.89 area with a curved ascending trend line up to $14.75. This trend line supported the price three times but finally broke on the last contact, initiating the start of a bearish wave from this trend line break.
📊 After the price reached the peak of $14.75, the market volume gradually decreased, and after forming a lower high and breaking the curved ascending trend line, the market momentum shifted and the bearish phase began.
🔽 The main correction trigger after the trend line break was the break of $11.28, which coincided with the 0.236 Fibonacci level, making this area a strong Potential Reversal Zone (PRZ). However, the bearish volume and momentum were strong enough to break this support.
🔍 Currently, the price is attempting to round off and form a bottom. It's also the Christmas holiday season, and the market volume has decreased, which could make it easier for whales and holders of this coin to facilitate bottom formation. Additionally, the price has reached the golden Fibonacci zone between 0.5 and 0.618, which could significantly influence the end of the correction and the continuation of the upward trend.
🧩 The RSI oscillator is also in a critical and interesting area. If it stabilizes below 30 and enters the Oversell region, there might be panic in the market, potentially leading to a sharp drop. For the continuation of the upward trend and a new bullish leg, the RSI needs to rise above the 50 area to introduce momentum into the market.
📉 If further correction occurs, the next support level is at $7.51, and in the event of panic and sharp declines, the next support would be at $4.89.
🔼 For long positions, if the momentum changes, the market will create a new structure and provide triggers, but currently, the only triggers are at $11.28 and $14.75. The next resistance will be at $17.96.
📝 Final Thoughts
This analysis reflects our opinions and is not financial advice.
Share your thoughts in the comments, and don’t forget to share this analysis with your friends! ❤️

I'm bullish on APT. Why?
1. DataDance Secures Multi-Million-Dollar Seed Funding Led by Hash Global (1 day ago)
Impact on APT: Positive
This indicates growing interest and investment in projects within the ecosystem Aptos is supporting. Increased funding in connected projects can lead to higher adoption, collaborations, and an eventual demand increase for APT.
2. Tomarket Announces Transition From TON to Aptos for Upcoming TOMA Token Release (1 week ago)
Impact on APT: Positive
A transition from another blockchain (TON) to Aptos suggests trust in Aptos' scalability, speed, or ecosystem. This can attract developers, investors, and users, potentially boosting APT's demand.
3. Tomarket Partners with Aptos Foundation to Launch PSECZ:TOMA and Build Future Products (2 weeks ago)
Impact on APT: Positive
Partnership news further establishes Aptos' utility and credibility in the blockchain space. Building products on Aptos could increase network activity and ecosystem growth, positively impacting APT.
4. Crypto VC Funding Witnessed a Significant Surge, Avalanche Gains $250M (2 weeks ago)
Impact on APT: Neutral to Slightly Positive
Although this is Avalanche-specific, it shows a general bullish sentiment in the crypto market. VC interest might also spill over to other projects like Aptos if its ecosystem remains active and innovative.
Overall Sentiment: The first three news items have a positive tone, which could help in stabilizing or pushing APT's price upward if paired with favorable market conditions.
One love; Sherry SOC.

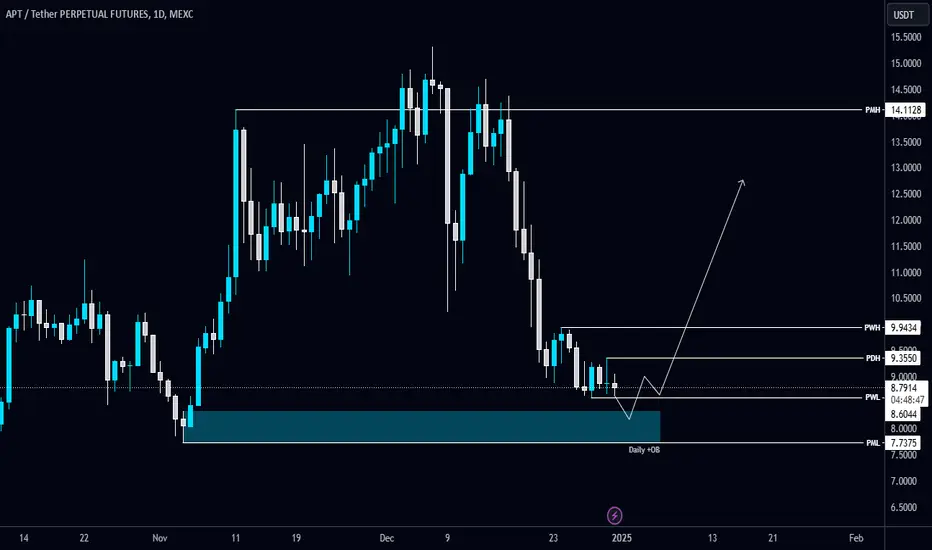
#APT/USDT Analysis#APT is holding the PWL $8.6 support level and anticipating liquidity to be swept below this level and a tap into the Daily FVG.
⚠️ Plan: Wait for Market Structure Shift (MSS) to confirm before taking long positions. The bulls might be gearing up!
APT - If patterns repeat, looks pretty bearishBearish in the symmetrical triangle - Every time the 20 MA crosses down through the 50 MA, there's a sidewise and downwards consolidation for a few months.
Will this time be different? Potentially
The chart needs to break above the top resistance to consider a position
Much better setups from a R/R perspective out there.

#APT(SPOT) entry range(5.95- 7.95) T.(15.99) SL(5.48)BINANCE:APTUSDT
entry range ( 5.95- 7.95)
Target1 (8.90) - Target2 (11.70)- Target3 (13.20)- Target4 (15.99)
SL .1D close below (5.48)
*** collect the coin slowly in the entry range ***
*** No FOMO - No Rush , it is a long journey ***
**** #Manta ,#OMNI, #DYM, #AI, #IO, #XAI , #ACE #NFP #RAD #WLD #ORDI #BLUR #SUI #Voxel #AEVO #VITE #APE #RDNT #FLUX #NMR #VANRY #TRB #HBAR #DGB #XEC #ERN #ALT #IO #ACA #HIVE #ASTR #ARDR #PIXEL #LTO #AERGO #SCRT #ATA #HOOK #FLOW #KSM #HFT #MINA #DATA #SC #JOE #RDNT #IQ #CFX #BICO #CTSI #KMD #FXS #DEGO #FORTH # AST #PORTAL #CYBER #CLV #RIF
ENJ #ZIL #APT ****

APT 1H UpdateI believe that if Aptos manages to break the resistance $9.3, we could see a significant rise from it 🫡🤍

APT/USDT Near Key Fibonacci Zone: Eyes on $18.93 Target
#APT Buy Zone: $7.30 to $8.97 (key support levels).
Targets:
🎯 $12.00
🎯 $15.00
🎯 $18.93
Overview: Upward channel with a potential 153.90% rise.
Note: Break above $10.00 confirms bullish momentum. Watch for accumulation opportunities in the $7.30-$8.97 range. 🚀

SPOT APT LONG 30.12.2024Pinning after containment of sales.
🎯Purpose:
11.91
‼️Risk per trade: 0.5-1% of the allocated funds for spot trading.
Thank you for follow and the reaction🚀.

APTOS APTOS Elliot Wave analysis
- This looks like a healthy structure on the way to the presented white Fibonacci levels between $ 27 and $ 38. Those targets are against the blues Fibonacci supports.

APT BUY...hello friends
Considering the support range we are in, we expect a short-term growth of this currency.
Be sure to observe capital management.
Be successful and profitable.


APTUSDT 1WAPT ~ 1W
#APT Has finished with the rising wave 5,. This is an Elliot Wave pattern, and usually this will be followed by an ABC correction. if this really happens,. then this support block would be a good buying place for now.

2 RRExpect this trade to go deep within the indicated range. If it hits the 5 min safety level, keep a tight target as indicated. If it doesn't reach this lvl, holding for a bigger target may be possible!

$APT 1D | HTF (Update)Everything that I have mentioned in the previous post is still valid/applies. As long as we defend the swing low (“S-LOW”), the price tends to move to higher levels. It can either be an SFP or a breaker , both of which are confirmed.
Happy trading


WHAT'S HAPPENING WITH APT?Why Aptos (APT) is currently falling?
1. Negative Sentiments:
The market has low confidence in Aptos due to its inability to maintain price stability compared to its peers.
2. Token Supply Unlock:
A major token unlock scheduled for January 11 will increase supply in the market, causing selling pressure.
3. Open Interest Decline:
Reduced open interest indicates traders are closing positions, signaling weakening interest.
4. CEO Stepdown:
Leadership changes often create uncertainty, leading to a lack of investor trust.
5. BTC's Bearish Influence:
Bitcoin’s price drop has a ripple effect on altcoins, including APT.
6. Market Conditions:
The overall cryptocurrency market remains volatile and bearish.

APTUSDT Technical Analysis: Risk-Reward Setup with Dynamic Sp.LvRisk: %17 | Reward: %45 and beyond
APTUSDT is exhibiting signs of potential price movement with significant technical indicators supporting the analysis. A noticeable bullish divergence on RSI and a temporary retracement towards a key support level may provide an ideal opportunity for long positions. Traders are advised to watch price action closely around the identified trendline and support zones for entry confirmations.
Trading suggestion:
A possible retracement to the $8.37 support line might occur.
Traders can consider setting buy orders based on price action confirmation near the suggested support and aim for mid to long-term targets.
Technical analysis:
The RSI is oversold, indicating potential upside momentum if the trendline is respected.
The DMF Index shows declining bearish pressure, hinting at a reversal possibility.
SL = Break below $6.91 support zone.
This setup offers a favorable risk-to-reward ratio with dynamic levels to monitor. Always trade with proper risk management strategies.

The key is whether it can rise above 9.39
Hello, traders.
If you "Follow", you can always get new information quickly.
Please click "Boost" as well.
Have a nice day today.
-------------------------------------
(APTUSDT 1W chart)
It seems that the M-Signal indicator on the 1M chart has started to be created.
Accordingly, the 7.41-9.39 section is an important support and resistance section.
When it shows support in the 7.41-9.39 section, it is a time to buy.
-
In order to turn into an uptrend, the price must be received above the MS-Signal (M-Signal on the 1W chart) indicator.
Therefore, the key is whether it can receive support and rise near 9.39.
-
The high point boundary section is formed in the 12.06-14.50 section, so if it rises above this section, it is expected to create a new upward wave.
If it falls below 7.41, it is expected to enter the mid- to long-term investment area.
Therefore, if possible, I think it would be better to trade when the price is maintained above 7.41 and wait and see if it falls below 7.41.
-
(1M chart)
-
Thank you for reading to the end.
I hope you have a successful trade.
--------------------------------------------------
- Big picture
I used TradingView's INDEX chart to check the entire section of BTC.
(BTCUSD 12M chart)
Looking at the big picture, it seems to have been maintaining an upward trend following a pattern since 2015.
That is, it is a pattern that maintains a 3-year uptrend and faces a 1-year downtrend.
Accordingly, the uptrend is expected to continue until 2025.
-
(LOG chart)
As you can see from the LOG chart, the uptrend is decreasing.
Accordingly, the 46K-48K range is expected to be a very important support and resistance range from a long-term perspective.
Therefore, we expect that we will not see prices below 44K-48K in the future.
-
The Fibonacci ratio on the left is the Fibonacci ratio of the uptrend that started in 2015.
In other words, it is the Fibonacci ratio of the first wave of the uptrend.
The Fibonacci ratio on the right is the Fibonacci ratio of the uptrend that started in 2019.
Therefore, this Fibonacci ratio is expected to be used until 2026.
-
No matter what anyone says, the chart has already been created and is already moving.
How to view and respond to this is up to you.
When the ATH is updated, there are no support and resistance points, so the Fibonacci ratio can be used appropriately.
However, although the Fibonacci ratio is useful for chart analysis, it is ambiguous when used as support and resistance.
This is because the user must directly select the important selection points required to create Fibonacci.
Therefore, since it is expressed differently depending on how the user specifies the selection points, it can be useful for chart analysis, but it can be seen as ambiguous when used for trading strategies.
1st : 44234.54
2nd : 61383.23
3rd : 89126.41
101875.70-106275.10 (Overshooting)
4th : 134018.28
151166.97-157451.83 (Overshooting)
5th : 178910.15
-----------------

