#APT 1D COMING SOON!The $8 area is an ideal zone for a buyback; consider my idea of a 40% decline from this point.
APTUSDT.PS trade ideas

Apt/UsdtBINANCE:APTUSDT
**Aptos (APT) Current Price: $10.62 💰**
- The current price of **Aptos (APT)** is at **$10.62**, which is a key **support level** for the price. This means that if the price holds around this level 📊, it could potentially prevent it from dropping further. Support levels act like a "floor" for the price, where demand (buyers) is strong enough to keep the price from falling.
---
**If Price Holds at $10.62 🛑, Resistance Levels Ahead:**
- **Resistance at $12 🚀**: The first major resistance level is around **$12**. This is a price point where there might be enough selling pressure (sellers) to slow down or stop the price from rising further. Think of it like a "ceiling" where the price could hit and struggle to break above.
- **Resistance at $13 🌟**: If the price breaks through $12, the next resistance is at **$13**. This is another level where the price may face increased selling pressure, making it harder for the price to go higher. However, if it breaks this resistance, it could signal further bullish momentum (more upward movement).
- **Resistance at $13.52 💥**: The final resistance level is around **$13.52**, which is likely the strongest point where the price could face significant resistance. If the price reaches this point and struggles to break through, it could signify a potential reversal or consolidation in price.
---
**Summary:**
- **Support at $10.62** 🔻: If the price holds this level, it might bounce back up.
- **Resistance Levels at $12, $13, $13.52** 🚀🌟💥: These are the points where price could face difficulty moving higher. If the price breaks through these, it could continue to rise.
---
**Not Financial Advice!** 🚨 Always remember to do your own research, as market prices can be volatile! 📈📉

APT Struggles With Resistance Amid Potential Reversal SignalsThe price of BINANCE:APTUSDT has shown a mix of bearish and bullish tendencies on the 1-hour chart. After fluctuating between $11.74 and $11.56, the price now faces resistance at $11.63 and $11.93, with support levels firmly established at $11.48 and $11.38. Recent price action suggests that APT is in a consolidation phase, with slight bearish undertones.
The 9 EMA has recently dipped below the 20 EMA, indicating short-term bearish momentum. This crossover aligns with the MACD histogram, which, despite showing a minor narrowing of bearish divergence, remains negative. RSI readings hovering below 50 suggest a lack of buying pressure, with the market leaning toward oversold conditions.
Trading Strategy: Traders looking to go short might consider entering near the resistance levels of $11.63 or $11.93 with a stop loss slightly above these points. Conversely, a long trade could be initiated near the support at $11.48, aiming for a recovery to $11.63. Patience is key as the market awaits a decisive breakout.

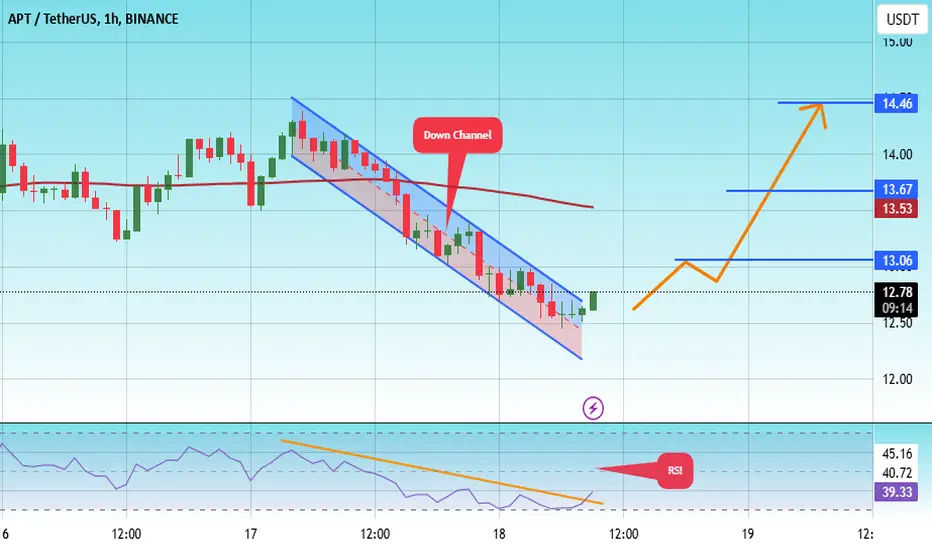
#APT/USDT Ready to go higher#APT
The price is moving in a descending channel on the 1-hour frame and sticking to it well
We have a bounce from the lower limit of the descending channel, this support is at 15.50
We have a downtrend on the RSI indicator that is about to be broken, which supports the rise
We have a trend to stabilize above the 100 moving average
Entry price 12.77
First target 13.06
Second target 13.76
Third target 14.46
APT/USDT )(APT)📈 Buy Signal for APT/USDT
✅ Suggestion: This is a market buy signal, and you can buy now.
🎯 Growth Expectation: I anticipate a 6% to 10% increase in the spot market.
📊 The labeled price targets will be reached soon. 🚀
💬 To manage this signal effectively and access even more opportunities:
1️⃣ Follow my TradingView page 📊
2️⃣ Send me a private message for further guidance.
💎 Let’s grow together and maximize profits! 💰

APT Short setup's As we approach the end of the year and liquidity in the market decreases, we might see some corrections happening. Wishing you a happy New Year in advance 🤍

Aptus (Apt)Apt usdt Daily analysis
Time frame daily
Risk rewards ratio >2 👈👌
Target 17$
We have a resistance area in 17_18 $
So my target is 17$ and I guess price will move up and down between 17 and 18 $ then will star to upper target 23$

APT weekly chartOn track towards 20$ and still in trend. Forming a double bottom in the weekly chart, trying to break down the uptrend line but the support in the uptrend is still quite strong.

APT IS BACK !let's keep it simple ,
we have nice retest on support level
target is 14.55 ( 10% )
stop loss : 4h close bellow 12.50 (-3%)
BINANCE:APTUSDT COINBASE:APTUSD

Accumulate $APT until it's too lateAccumulate AMEX:APT until it's too late❗️
#APT has been accumulating inside of Ascending Triangle for 777 Days so far🔥
The analysis indicates a strong bullish momentum for the coin as it approaches the key resistance level between $16.00 and $18.00. A clear ascending triangle pattern suggests a high probability of a breakout. If successful, the price may surge to $22.00 - $35.00. However, failure to break the resistance could lead to a correction toward the primary support level at $7.50. This is a crucial zone to monitor for future market direction.

APTAPT / USDT
Recent nasty dump is fully absorbed in just few hours
it looks like the price is heading toward this massive range high (18$- 20$ area )
After that IF market conditions remains good #APT could fly harder than you think
Lets see

APTUSDT Is a Bullish Breakout Coming, or Will Support Give Way?Yello, Paradisers! Are you keeping an eye on #APTUSDT? This setup could deliver significant gains or signal a sharp pullback—let’s break it down.
💎#APT recently made a strong rebound from its support zone, suggesting the potential for bullish continuation if it can break above the minor resistance at 15.36. A successful breakout here could trigger a mid-term rally, with the major resistance zone as the next target.
💎However, there are critical levels to watch. If APT fails to break 15.36, the price might pull back to the support area between 11.20 and 10.40. If this zone holds, we could see a rebound and another attempt at the minor resistance.
💎If the 11.20–10.40 support doesn’t hold, the price could dip further into the demand zone at 9.60. A liquidity sweep here might spark a stronger rebound and a renewed upward movement.
💎It’s important to stay cautious. If APT breaks below the strong support at 9.60 and closes a daily candle below it, the bullish case will be invalidated, and further downside may follow.
Be patient, wait for clear confirmations, and manage your risks wisely. Consistency and discipline are the keys to navigating opportunities like this one. Stay focused and trade strategically.
MyCryptoParadise
iFeel the success🌴

Not yet APT, not yetUnlike its successful cousin SUI, it seems APT needs to take longer to consolidate for any strong upward movement, watch the triangle


APT/USDT Trading ScenarioIn a persistently optimistic market environment, APT has shown a strong increase of over 250% from its local low, reaching $15.3.
Despite a sharp correction, the asset’s growth potential remains significant. Volume profile analysis indicates steady interest from market participants within the current price range. The asset is currently trading near the Point of Control (POC), a strong support zone, making it an attractive buying opportunity for anticipating a continuation of the upward trend.

$APT 1D | HTF w/ Market Structure notesI am following this chart and took some notes on the market structure of Aptos which is very useful for the future price action. As long as we defend the swing low, " S-LOW " the price tends to go to the higher levels.
Happy Trading

APT plan Im expecting a pullback of APT in orange zone where I will do spot buy. Do not trade in leverage right now. I expect btc to go lower at the moment.

Aptos just hit my target buy.Aptos just made a higher low. I think its a great buy opportunity. Buy, Buy and buy. I still think we can go bit lower. I would DCA around this range.

Aptos to start getting all the attention againAt the moment 98.8-98.5 sell pressure is very high. Bitcoin trying to reclaim 99-99.5 but in mu opinion it will retest lower.
I have my limits for Apt for starting 3-4 weeks bull run

#APT/USDT Ready to go higher#APT
The price is moving in a descending channel on the 1-hour frame and sticking to it well
We have a bounce from the lower limit of the descending channel, this support is at 13.20
We have a downtrend on the RSI indicator that is about to break, which supports the rise
We have a trend to stabilize above the moving average 100
Entry price 13.52
First target 14.07
Second target 14.48
Third target 14.94

APT/USDT Monthly Analysis$APT/USDT Monthly Analysis
#APT A breakout above $20.05 confirms the cup-and-handle pattern, targeting a rally toward $37.73 in the medium to long term.
Pullback Opportunity:
If the price retraces, entries near $12.00 offer an excellent risk-to-reward setup for long positions.
Conclusion:
APT is showing strong bullish potential with a classic cup-and-handle formation. Traders should monitor the breakout level at $20.05 closely, as it could lead to a rally toward $37.73. Support at $12.00 provides a solid entry zone, while stop-losses near $10.25 ensure effective risk management.

APTUSDT - Real project ... Potential targets!APT is one of the important coins in layer1 Network with (7.65B marketcap)
if u want to triple ur capital then buy APT!
- Strong project
- Ranked 25 in marketcap
- displays a Cup and Handle pattern in weekly chart
- Hasn't moved strongly yet
Best regards Ceciliones🎯

I don't think APT could conquare new ATH in this RunPlease share your idea with me in comments.
90B$ market cap is not feasible for ATP USDT
