Alikze »» APT | Forming a head and shoulders pattern - 2D🔍 Technical analysis: Forming a head and shoulders pattern
- It is moving in an ascending channel in the daily time frame.
- After the touch neck line and also the failure of swing and poleback to it, it has continued its growth up to the ceiling of the channel.
- Currently, an AB=CD pattern is formed.
- In addition, a head and shoulder pattern is also observed in the daily and weekly time frames.
- Therefore, it can have another growth in the middle of the channel after a temporary correction, up to the area of the width and roof of the channel.
💎In addition, it can continue its growth until the next supply zone after the failure of the supply zone and pullback to it.
🚨 Note: The support area of 6.25 is the validity area of the analysis, if the candlestick stabilizes below the area, the bullish pattern will be invalidated. 🚨
»»»«««»»»«««»»»«««
Please support this idea with a LIKE and COMMENT if you find it useful and Click "Follow" on our profile if you'd like these trade ideas delivered straight to your email in the future.
Thanks for your continued support.
Best Regards,❤️
Alikze.
»»»«««»»»«««»»»«««
BINANCE:APTUSDT
APTUSDT.PS trade ideas

APTUSDT LONG AGAIN AFTER LAST FULL TP.APTUSDT is bullish and you have seen in our last APTUSDT trade that we have made full TP. And now I have found another great setup on this chart. Demand zone is below the sell side liquidity, when price will come down to fill FVG and grab that liquidity then we will enter LONG in this demand zone.

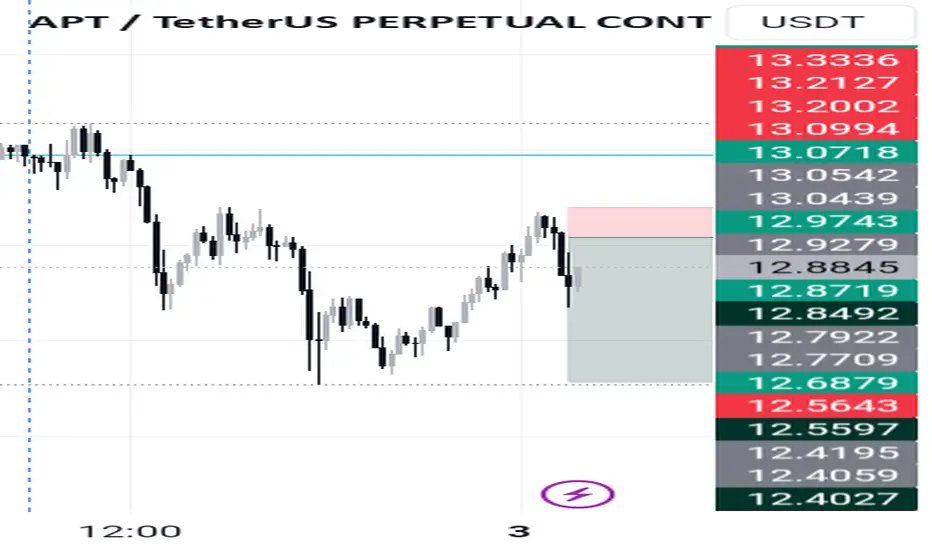
#APT/USDT Ready to go higher#APT
The price is moving in a descending channel on a 15-minute frame and sticking to it well
We have a bounce from the lower limit of the descending channel, this support is at 13.00
We have a downtrend on the RSI indicator that is about to be broken, which supports the rise
We have a trend to stabilize above the moving average 100
Entry price 13.40
First target 13.73
Second target 14.19
Third target 14.62

PerpotentialHello friends
APT entered TR after a good trend and with its failure we expect good growth from it.
We have specified its targets in the picture for you if the range is maintained and the price increases.
Don't forget capital management.
GOOD LUCK

APTUSDT TAKE PROFIT DONE.APTUSDT yesterday chart was shared and today entry filled and full TP done.

#APT/USDT Ready to go higher#APT
The price is moving in a descending channel on the 30-minute frame and sticking to it well
We have a bounce from the lower limit of the descending channel, this support is at a price of 12.33
We have a downtrend on the RSI indicator that is about to be broken, which supports the rise
We have a trend to stabilize above the moving average 100
Entry price 12.80
First target 13.18
Second target 13.57
Third target 13.96

TradeCityPro | APTUSDT Bullish Correction & Continuation👋 Welcome to the TradeCityPro channel!
Let's start the week by analyzing APTUSDT, one of the altcoins with a promising setup.
📊 Bitcoin Overview
At the New York market open, Bitcoin has printed a few green candles , Meanwhile, BTC dominance (BTC.D) has been declining, breathing new life into altcoins.
As long as BTC.D continues to drop, altcoins will likely remain active and bullish.
🕒 Weekly Timeframe
APTUSDT has been trading in a long-term range box for nearly 700 days, fluctuating within it since its listing.
Unlike many other altcoins, APTUSDT has never dropped to its final support at $3.45, instead finding consistent support at $5.50–$5.77, giving it an edge over its peers.
Currently, there's no weekly trigger for buying , bounce of the RSI from 70 could signal the continuation of its upward momentum.
🚀 Daily Timeframe
APTUSDT has rallied beautifully from $5.67 support, reaching resistance at $13.66, where it was rejected. After consolidating for a few days, it is now moving back toward that resistance.
The chart shows a parabolic uptrend, with higher highs and higher lows forming consistently , Each time the price touches this parabolic trendline, it bounces upward, suggesting this structure might persist.
break of the parabola would likely signal a short-term correction, not necessarily a bearish market reversal.
For a buy, wait for a breakout above $13.66 with increased volume and RSI entering overbought territory. & Suggested stop-loss Risky: $10.50 - Safer: $7.51
If the market corrects, look for a bounce at $10.50 support with a confirming bullish candle for a mid-term hold.
⏳ 4H Timeframe
APTUSDT has been ranging between $11.22 and $13.78 for a few days, making the triggers clear for trading.
📈 Long Position Trigger
breakout above $13.78 would provide a strong trigger for a long position. You can even set a stop-buy order before the breakout.
📉 Short Position Trigger
Avoid shorting as the overall market setup remains bullish. Instead, focus on other opportunities like DeFi or researching promising projects :))
💡 BTC Pair Insight
Against Bitcoin, APTUSDT shares a similar setup to other altcoins, consolidating in its range.
breakout above 0.0001624 BTC could signal fresh inflows into APTUSDT and spark a bullish movement.
📝 Final Thoughts
Stay calm, trade wisely, and let's capture the market's best opportunities!
This analysis reflects our opinions and is not financial advice.
Share your thoughts in the comments, and don’t forget to share this analysis with your friends! ❤️

#APT/USDT
#APT
We have a trend to stabilize above the moving average 100 again.
We have a downtrend on the RSI indicator that supports the rise by breaking it upwards.
We have a support area at the lower limit of the channel at a price of
11.00
Entry price 11.50
First target 12.42
Second target 13.07
Third target 13.89

APTUSDT TRADE UDEA.APTUSDT is looking good for long trade. I have marked DEMAND ZONE below the liquidity cluster as SSL. When price will come down to grab that liquidity then we will enter long in marked DEMAND ZONE.


$APT TIME TO RETRACEIn 10 hours, APT has gone up +45%.
I believe it is due for a pullback.
Under $10.50 we should see more downside.

$APT Get Ready For Pullback! Up 280% in 14 days with not much to back up price action.
When overall markets take a turn, expect $APT to fall the quickest.

APT/USDT AnalysisAPT/USDT Analysis
Current Price: $13.12, up 11.28% in the last session.
The chart shows a formation of a rounded bottom pattern, indicating a bullish outlook and potential continuation toward higher levels.
Target Levels:
Target 1 (T1): $15.68
Target 2 (T2): $23.13
Target 3 (T3): $30.89

APTOS - APT COIN SWING LONG IDEA - ALTCOIN MARKET - CRYPTOAptos is one of the most useful Layer 1 chains in crypto right now. I believe the fundamentals of this coin are remarkable, and I expect it to perform well during the 2024-2025 crypto bull market.
The price is coming from the monthly demand zone. It swept the 2024 spring low before getting rejected from the monthly demand, which created strong bullish momentum. It also broke the diagonal trendline responsible for the bearish movement. Currently, both weekly and daily momentum are strongly bullish.
I expect the price to hit the daily demand zone and take off from there. It might form a small range around this level, but I believe we are targeting all-time highs.


Golden Opportunity: A Massive Rally Is Coming for This APTLooking for a profitable opportunity? This crypto pair is gearing up for a big move to 20. Stay tuned!

#APT 1D: Sharp Moves Ahead – Plan Your Trade! 11/28/24The price is currently consolidating within a range. Historically, such accumulation phases often precede sharp upward moves, particularly in favorable market conditions. Given Aptos' behavior, it’s also capable of diverging positively from the broader market trends.
I plan to enter the position using two limit orders at $11.74 and $10.94. My exit strategy involves three limit orders at $15.87, $17.83, and $20.43. Stop-loss levels are indicated on the chart (note: no stop-loss for spot positions).
DYOR.


Trading opportunity for APTUSDTBased on technical factors there is a Buy position in :
📊 APTUSDT
🔵 Buy Now
🪫Stop loss 11.50
🔋Target 1 15.00
🔋Target 2 19.50
🔋Target 3 25.00
💸RISK : 1%
We hope it is profitable for you ❤️
Please support our activity with your likes👍 and comments📝

Aptos: How Much Leverage Should I Use? Trading BasicsThe reason why I am doing lower leverage on my APTUSDT (Aptos) LONG trade is because it has been green for three weeks already. The support is set at EMA55/89 and thus I am a bit late for a LONG trade. When I am late, rather than dismiss the chart setup all together instead I opt for lower lev.
If I caught the entry around $8, leverage would be really high. Since the entry now is above $10, leverage should be low. For my trades and for my people of course... We adapt to the market and the charts and try always to seek low risk vs a high potential for reward.
Volume is rising. And last week produced the highest volume since January 2023. This is happening above support (red on the chart).
We look at each pair as a chart setup. The chart setup can be either bearish or bullish. This chart setup is strongly bullish above support and this works long-term. Whenever APTUSDT trades above the red space on the chart, we are bullish. If it trades below, the bearish potential opens up.
Below support this chart setup is still bullish long-term but short-term conditions change.
Anyway, I am mapping a fast and easy wave for you on this chart. Seeing what the other Altcoins are doing, we can expect a strong move once this pair starts to move. We can expect a strong jump when bullish momentum grows. We can expect a strong rise since Aptos has been rising already since August 2024. The slow rise can be considered bullish consolidation. Consolidating while moving higher; it is moving higher but still consolidation because an impulse tends to produce strong green candles. And that's what we expect.
Market conditions can vary. The chart can always change.
This is not a sure win but the chart is bullish.
We have the support of the market here to go LONG, why? Because Bitcoin is trading at new All-Time Highs, and the Altcoins are moving strong. What one does, the rest follows!
Thanks a lot for your continued support.
Namaste.

APT Long Sl -12.2%APT Long Setup
Reason:
Bullish Pennant has been observed.
Resistance level has been already Broken.
Before this big move, expecting liquidity to be grab and also retesting the support level.
Fibonacci level yet to be test near the support area
LTF Suggesting bearish move for short term, overall structure is still bullish.
We will wait for all possible liquidity to be taken first from the market then will enter.
Best Regards,
Crypto Panda
BINANCE:APTUSDT
BYBIT:APTUSDT.P
KUCOIN:APTUSDT
MEXC:APTUSDT

