TLS trade ideas

TLS.ASX: technical analysisTelstra shares are still on the slippery slide. Short sellers will be watching closely for another fail attempt to cross over 2.92 resistance. Other support and resistance marked on the chart could be relevant for future price movements

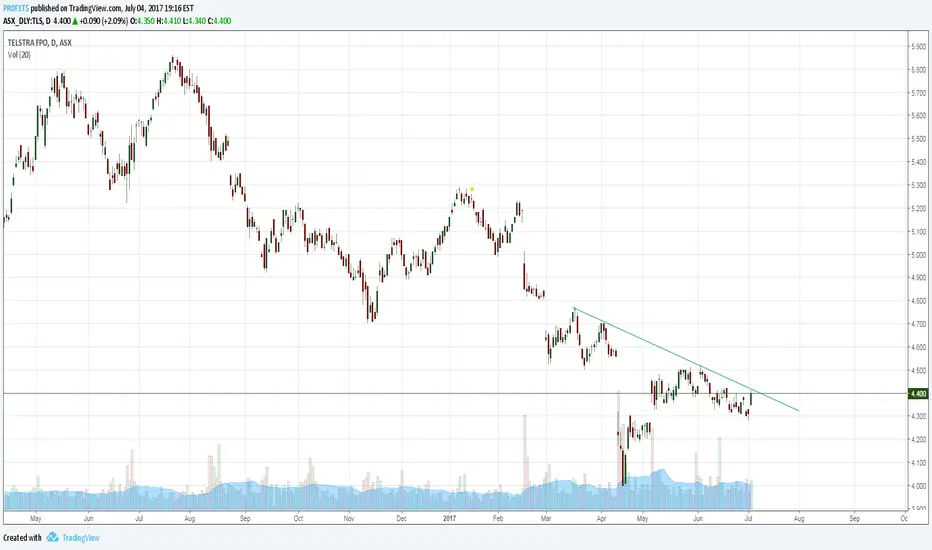
TLS finding some support at falling supportline $TLS.AX #TelstraTLS finding some support at falling support line

SET UP A LONG TRADE FOR TLSIN WEEKLY CHART, THE PRICE HIT THE TREND LINE.
However, we need to wait for the long signal before entry.
and today or late this week, we will get the answer.


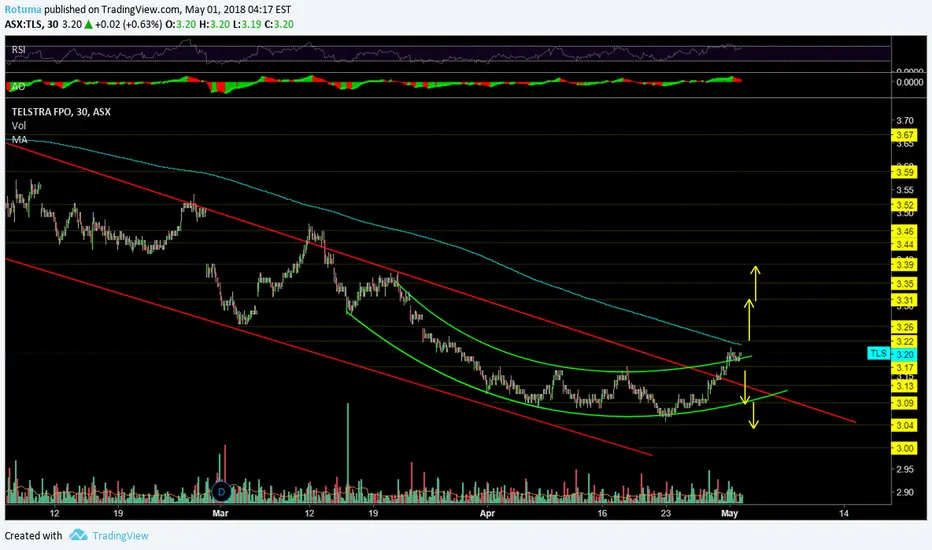
TLS.ASX - Short to medium term share price forecastI have been watching TLS shares trading activities closely with great interest for the last six trading days and noticed an increase in volume and momentum to the upside. Share prices closed today's session 1/5/2018 in the green zone for 6 consecutive days.
It has also broken out of the downward price channel to the upside closing just above 3.17, a critical resistance price point no turn support.
Share prices need to break and hold above 3.22 and also it's 500 EMA in blue colour before we could confirm a reversal to the upside.If successful then we could be looking at 3.26 and 3.31 the next two target/resistance price points
Failure to hold above 3.17 could see prices fall to around 3.13-3.09
Telstra (TLS) Analysis - 1 Month CandlesTLS has been on a downtrend since 2015. It looks like it has now completed its ABC correction right to the 78.6% retracement mark. There is a five wave pattern within it's most recent downtrend, shown within the dotted downtrend channel. As TLS has now looked to have completed its ABC correction after a strong run up from 2010 to 2015, it looks to have now started a new market cycle. Be on the look out for the downtrend channel to be broken and for the trend line to be a possible new support.


$TLS 2bar reversal (daily)TLS closed back above vwap
Been toyed with for a while now, if brakes off COULD move back up pretty quick keeping weak hands out OR
just create a new range, keep an eye out for a confirmed upthrust for range top... and sell or whatever :-}
Holding from $3.26


Could Telsta finally be carving a bottom?-26 week horizontal range
-Declining volume
-Unsure at this stage but watching for reversal or continuation of trend

Telstra tlsEnd of wave 2 already happened or will be happening soon at 3 AUD. Anyway upside potential is huge.....

TLS CBLso i applied guppys CBL (count back line ) to the month chart .
We will buy more TLs when CBL is broken and RSI trend line is also broken

TLS: month , support levels holding so far.looking at the month chart, we see the price is holding above the bottom of the trend channel. this intercepts with the 78% fibonacci level. GOOD buying opportunity.

TelstraASX:TLS Weekly chart, if the price bounces from the support zone formed by $3.38 and weekly break above $3.72 then it will get a buy opportunity.
ASX:TLS since listed on ASX back in 1999, it's first time RSI have drop to 12.85 and is oversold zone,if RSI break above 30 then it is going to confirm price reversal.
If the price drops below the support zone formed by $3.38 then we should wait for new trading opportunities.