ATOM 4H – Potential Wave 3 Impulse SetupAfter a completed 5-wave impulse (likely Wave 1), followed by a corrective Wave 2, ATOM appears to be setting up for a potential Wave 3 to the upside based on Elliott Wave Theory.
This setup aligns with the idea of Wave 3 being typically the strongest and most extended move in the cycle.
📍Entry Zo

$ATOM Breakout Above Key Resistance – Bullish ReversalNASDAQ:ATOM has just broken through a key resistance zone, reclaiming the 100 EMA with confidence and confirming a strong trend reversal.
This move has triggered a powerful breakout, backed by volume and bullish price structure.
DYOR, NFA

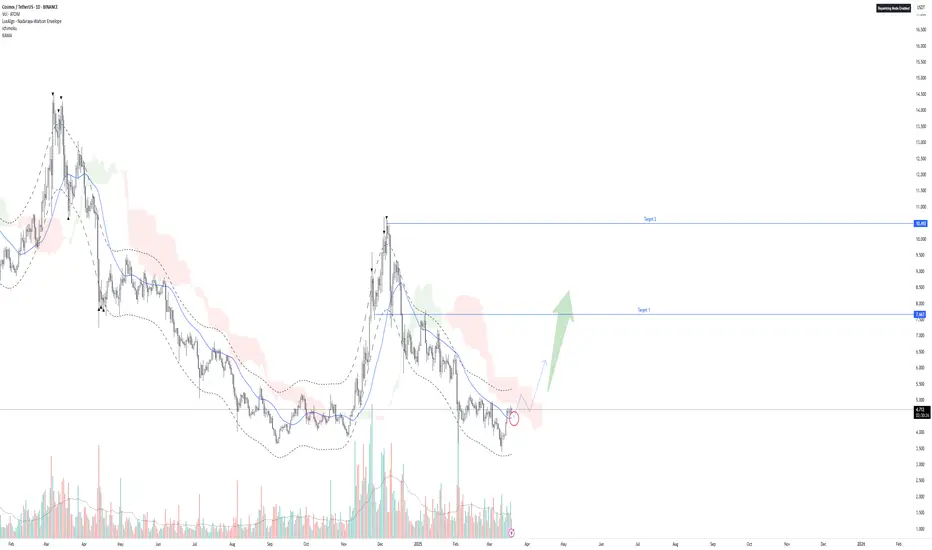
$ATOM Ready for Liftoff – 100%+ Move on the TableNASDAQ:ATOM has just broken out of the trendline and is converting the major resistance into support.
This breakout could be the start of something huge - the chart shows potential 100 %+ movement ahead of it.
Looking forward to a retest around the $4.73 mark before the next move upwards towards

Cosmos (ATOM): Buyers Pressuring Resistance Zones | Price at EMACosmos coin had reached one of the resistance zones where the price has filled major FVG zones. As the price of the coin is expanding, we are looking for possible zones of rejection or correctional zones where we will be looking for market structure breaks.
$4.40, $4.50 and $4.70 are the zones tha

ATOM/USDT review chart 4HHello everyone, let's look at the 4H ATOM chart for USDT, in this situation we can see how the price has affected from the upper limit of the downward trend channel, however, staying in the upper part of the channel. Going further, let's check the places of potential target for the price:
T1 = $

atom buy midterm "🌟 Welcome to Golden Candle! 🌟
We're a team of 📈 passionate traders 📉 who love sharing our 🔍 technical analysis insights 🔎 with the TradingView community. 🌎
Our goal is to provide 💡 valuable perspectives 💡 on market trends and patterns, but 🚫 please note that our analyses are not intended as buy o

ATOM at a Crossroads: Breakout or Rejection?ATOM just pulled off a little victory, sneaking past the moving average—but the real show starts if it can break through that thick red Ichimoku cloud. The big question: will it act as a resistance wall or a launchpad for a move up? That all depends on us holding above that circled area. The market’
Cosmos (Atom)Atom usdt Daily analysis
Time frame daily
We have 2 models of analysis
1. The green line. Price can't break the resistance line and fall down to 3.5$
2. Price can break the resistance (gray line) and pump to 9$
Therfore we must watch the reaction of price and resistance

ATOMUSDT 1D AnalysisATOM ~ 1D Analysis
#ATOM Buy after successfully penetrating this resistant line with a short -term target of at least 10%+ from here.

ATOMUSDT Potential UpsidesHey Traders, in today's trading session we are monitoring ATOMUSDT fora buying opportunity around 4.30 zone, ATOM is trading in an uptrend and currently is in a correction phase in which it is approaching the trend at 4.30 support and resistance area.
Trade safe, Joe.

See all ideas
Summarizing what the indicators are suggesting.
Oscillators
Neutral
SellBuy
Strong sellStrong buy
Strong sellSellNeutralBuyStrong buy
Oscillators
Neutral
SellBuy
Strong sellStrong buy
Strong sellSellNeutralBuyStrong buy
Summary
Neutral
SellBuy
Strong sellStrong buy
Strong sellSellNeutralBuyStrong buy
Summary
Neutral
SellBuy
Strong sellStrong buy
Strong sellSellNeutralBuyStrong buy
Summary
Neutral
SellBuy
Strong sellStrong buy
Strong sellSellNeutralBuyStrong buy
Moving Averages
Neutral
SellBuy
Strong sellStrong buy
Strong sellSellNeutralBuyStrong buy
Moving Averages
Neutral
SellBuy
Strong sellStrong buy
Strong sellSellNeutralBuyStrong buy
Displays a symbol's price movements over previous years to identify recurring trends.