ATOM/USDT looking bullish? 👀 🚀Cosmos Today AnalysisParadisers, turn your attention to Atom! It's poised for a bullish ascent, currently residing in a demand zone and having recently addressed the OB level👀
💎 A notable shift from demand to supply has been observed, propelling the price on a downward trajectory, leaving behind a clear imbalance and a bearish OB. Given the liquidity, it's anticipated that the price will revisit this level soon.
💎 Additionally, Atom is on the brink of crossing over the EMA 55. Should it sustain its momentum above this EMA, we could witness a substantial bullish surge.
💎 In the dynamic world of crypto, staying informed and adaptable is key. Stay tuned for more updates and enjoy your trading journey
ATOMUSDT.P trade ideas

ATOM/USDTIN SCALP TIME ;
you can enter your tiny short around 8.55.....that is scalp fast entery fast exit...
Good luck


ATOMUSDT Trend Reversal ? At this point the whole picture is not clear and it all depends to the king then we can decide on the alt market .
But as far as the H1 chart on Crocobot says it's the perfect time to hump on a long trade . Trade WL ratio is too good to be true but hey sometimes we are at the right place in the write time ha ?


ATOMUSDTThe price can grow from the specified range. Do not enter without the trigger
It is only a prediction and possibility and should not be based on anyone's decision...

ATOM is at the MAJOR SUPPORTATOM is at the monthly support rn. We can see strong bounce in middle term.

ATOM - Only pointing down
The analysis is pretty straightforward:
- Gray trendline was broken, but there was no follow-through and it is currently support.
- Green trendline holding price to the downside
- No RSI divergence
Therefore, the higher probability points to another lower low, targeting $7.

ATOMUSD ❕ descending wedgeTD Sequential formed a reversal signal up (4H TF)
Price and RSI chart formed a convergence (30m TF)
I believe the asset will rebound if it holds the current support.

ATOM/USDT nice potential for bullish movement! Hey traders 👋
ATOM coin is next on our watchlist. Well we won't keep it long here as everything is displayed on the chart!
Good chance for a "double bottom" pattern to form here - but we need a bullish momentum near second leg in order for this pattern to work! Waiting....
If you like ideas provided by our team you can show us your support by liking and commenting.
Yours Sincerely,
Swallow Team
Disclamer:
We are not financial advisors. The content that we share on this website are for educational purposes and are our own personal opinions.

#ATOM/USDT breaking the Falling Wedge Pattern in 4-Hour TF!Wait for PDH $8.6 BO to open a Long. The support level is PWL $8.360.


ATOM has a very good opportunity Hi Everyone;
today we have one of the best risk to reward Investment opportunity
it is more than 190 times the risk and the chart is look very promising.
I expect breaking the previous bear market key point will clear the way to the final target


ATOM USDT PERP Hello Trader BINANCE:ATOMUSDT.P
in the area of the 1-hour support point
it can be scalped for short-term
short term because the fear is sustained bearish
Please add a comment and Positive feedback and
constructive criticism are important to authors and the
community.
Disclamer: Not Financial Advice

2 scenarios on price action of ATOM/USDT2 scenarios depending on weather price ascends past or is rejected from $8.826/USDT. Price to the upside looking most likely given BTC's action as of late.

#ATOMUSDT#LQR #TOBTC #LaqiraProtocolSupport and resistance are obtained from the confluence of static levels and fibulations. After confirming and matching with Bitcoin levels, you can open a position this analysis is not a buy or sell offer.

ATOMUSD ❕ fixed under the supportATOM has fixed under 50EMA on the 4H TF.
RSI is moving in the bearish zone.
I expect the decline to continue.

Cosmos shortCosmos broke trough the support level. Asset broke trough the ascending trendline. Bearish movement to support level at 8.28 is possible.

Atom/usdt possible longThe daily level confluences with the golden gap or CC of the .618 and .66 fib levels that will be a very strong support for our entry to targer the above weekly and monthly levels.
I think it will be reclaiming the above daily levels before retracing to our entry.
Setup as follow:
Entry: 8.228
SL: 8.094
TP: 10.894

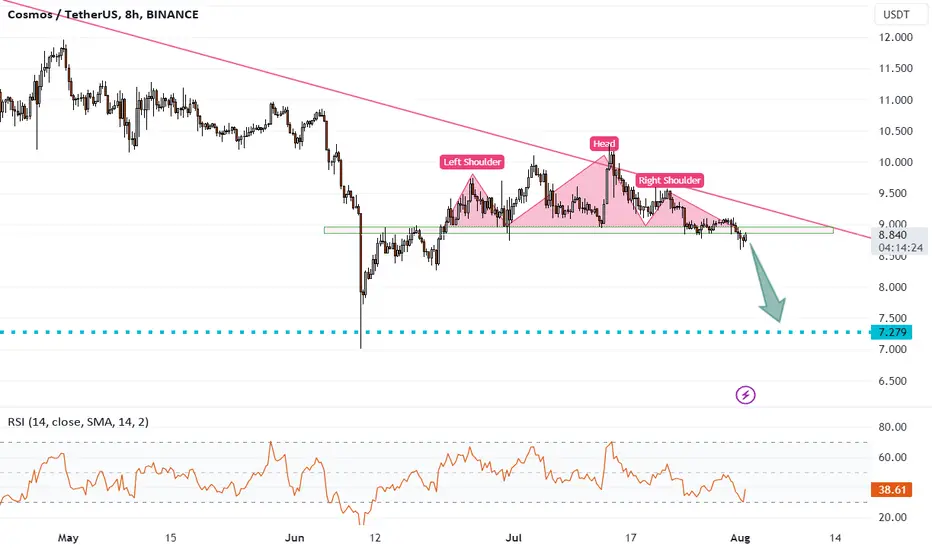
ATOMUSDT growth is not expectedHello everyone! According to ATOMUSDT, the thoughts are as follows: the coin has been in a downtrend for a long time and a trend change is not expected. Therefore, on smaller timeframes, I tried to catch further price movement, of course downwards. At the moment, the coin has drawn something similar to "head and shoulders", although it turned out to be two heads. In any case, there are very good chances after such a pattern to go at least to the past minimum values of 7.2
ATOMUSDT Long/Short (Just an IDEA)Atom will head towards the Immediate resistance are @ 9.2-9.3 area, a strong breakout from the resistance can lead ATOM to hit 10.5-10.6 Area..
This is just an IDEA, Plz DYOR n its NAFA
Thank You

ATOMUSDT is testing the key levelBased on the provided information, the price of ATOMUSDT has recently grabbed new liquidity below the $9 area, and subsequently, it has retraced to retest the weekly support level. This movement suggests that there is a potential accumulation phase happening, with buyers showing interest in the asset at lower price levels.
If the price manages to break above the daily resistance at the $9.3 area, it could signal a bullish breakout according to Plancton's Rules. A bullish breakout occurs when the price surpasses a significant resistance level, indicating a potential shift in market sentiment from bearish to bullish.
According to Plancton's Rules, in this scenario, a new long position is suggested. A long position involves buying the asset with the expectation that its price will rise. By initiating a long position after the breakout, traders aim to take advantage of the potential upward momentum and price appreciation that may follow.
–––––
Follow the Shrimp 🦐
Keep in mind.
🟣 Purple structure -> Monthly structure.
🔴 Red structure -> Weekly structure.
🔵 Blue structure -> Daily structure.
🟡 Yellow structure -> 4h structure.
⚫️ Black structure -> <= 1h structure.
Follow the Shrimp 🦐
