Cosmos possible adam and evePossible double bottom on trendline with an Adam and Eve formation.
Will take sometime to develop if correct.
ATOMUSDT.P trade ideas

$ATOM Risky long but long. The scenario is good for a pump in atom yet dangerous as BTC is on the verge of a crash.
But let's keep the SL and be patient.

Atom Long Fractal in play i think, expecting the price to be pushed up filling both the weekly imbalances, also confluent with a golden pocket btw swings.
Lvl holding pretty well so far, bb squeeze trigger, EMA ribbons trigger long small tf..
NFA

Cosmos shortCosmos bounced off the descending trendline. Asset bounced off the resistance level. Bearish movement to support level at 10.61 is possible.

🔥ATOM CLOSE TO HUGE VALUE AREA: $20 IS STILL POSSIBLE🔥Hi, friends! dYdX migrates from Ethereum to Cosmos (ATOM) blockchain.
USDC's co-issuer, Circle, has also announced the launch of a stablecoin on the Cosmos network.
This fundamental news can trigger ATOM growth up to $20. We should pay attention to the chart and find the best entry point before 90% growth.
📊 TRADING PLAN FOR ATOM:
🔥 test the $9.5-10.5 value area as the support
🔥 volume growth
🔥 squeeze to the trendline
🔥 bullish BTC is a must-have for altcoins growth
✅ MY LONG TARGETS FOR ATOM:
1. $13.5 - the key level
2. $15.5 - the key level and local high
3. $20 - the even number and key level
💻Friends, press the "boost"🚀 button, write comments and share with your friends - it will be the best THANK YOU.
P.S. Personally, I open an entry if the price shows it according to my strategy.
Always do your analysis before making a trade.

$ATOM - Short Trade Set-Up$ATOM - Short Trade Set-Up
Entry Conditions:
| Rejection from bearish trednline
| Failed to break the 200 EMA Daily
| Big Bearish Divergence
| About to break RSI Support

🔥✅THE BEST TRADING PLAN FOR ATOM: $10 IS A CLOSEST TARGET🔥 Hi friends! Today I'll show you the most possible trading plan for ATOM.
We see how the price bounced from the $9.8-10.3 value area. I think it will happen one more time because this value area is strong resistance to the price.
✅ Now we should wait for some pullback to enter a long with a target at $10 as it is shown on the chart.
The price can go even higher if it breaks the value area and tests it as support! But when the price reaches this value area, I recommend you keep your attention on the chart. A false breakout is a very common thing after such growth.
🚩 If we compare the previous example to this situation, we will see that after the first test of the value area the price fell by -15%. The same can happen this time.
✅ The short target is an $8.5 key level and even lower to $8.
🔥 Stay tuned to get more updates and ask questions in the comments to get help in trading!
💻Friends, press the "boost"🚀 button, write comments and share with your friends - it will be the best THANK YOU.
P.S. Personally, I open an entry if the price shows it according to my strategy.
Always do your analysis before making a trade.

ATOMUSDT LAST HOPEAtom has been the worst performer among cryptocurrencies so far. The last place to throw Atom up or down is approaching. I am an optimist and want to open a long position. This is not a financial advice and only my personal opinion.


ATOMUSD ❕ oversoldATOM is oversold by several indicators.
The chart has reached the lower boundary of the channel.
I think the asset will bounce from the border.

Cosmos coin is in an optimal buying zoneThe price of Cosmos coin is currently in the optimal buying zone, ranging between $11.41 and $10.31, with a local selling target of $19.54. This asset is in an uptrend, which is a favorable factor for further price growth. In case the price falls below the upward trend, a stop loss is set to protect the position at $8.43. The setup is expected to be realized in April. Additionally, there are plans to double the position after overcoming the downtrend.

ATOM bearishATOM follow down channel
It was rejected from EMA20,50 and 200
Two support are is possible
A and B
Becase A was knocked 2 times, it could not be strong enough

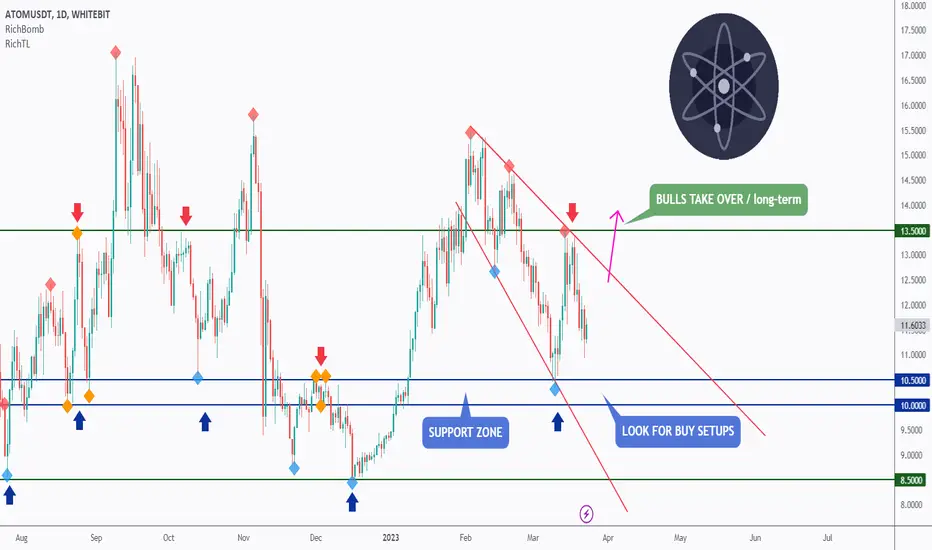
ATOM - Once a Beast; Always a Beast 🦾Hello TradingView Family / Fellow Traders. This is Richard, also known as theSignalyst.
ATOM has been overall bearish trading inside the falling broadening wedge pattern in red.
🏹 For the bulls to take over long-term , we need a daily candle close above 13.5 resistance.
Meanwhile, If we retest the blue support around 10.0, we will be looking for buy setups on lower timeframes.
📚 Always follow your trading plan regarding entry, risk management, and trade management.
Good luck!
All Strategies Are Good; If Managed Properly!
~Rich

Cosmos (ATOM) formed bullish Gartley for upto 13% pumpHi dear friends, hope you are well and welcome to the new update on Cosmos (ATOM) coin.
Previously I shared a long-term trade setup for ATOM, which is still in play as below:
On a 4-hr time frame, ATOM has formed a bullish Gartley move for another price reversal.
Note: Above idea is for educational purpose only. It is advised to diversify and strictly follow the stop loss, and don't get stuck with trade

ATOMUSDT - 12h timeframeI have entered into a long position in Atom as I believe that wave 2 on the 12-hour timeframe is soon to be completed. This gives me reason to believe that wave 3 will soon follow, which I plan to ride in order to profit from the price increase.
It's important to note that the Elliott Wave Theory is not a guaranteed predictor of market trends, and conditions can always change. However, I believe that the current market conditions suggest that Atom is poised for a price increase, and I am confident in my decision to enter this long position.
As always, it's important to closely monitor market conditions and adjust your position accordingly. However, I am optimistic about the potential for profit in this long position and am excited to see how it develops.
BINANCE:ATOMUSDTPERP
Long Entries:
11.52
10.95
9.79
TP Levels currently only ideas and not finally planned:
18.83
26.37

ATOMUSDT is forming the pennantATOMUSDT has recently tested the 0.618 Fibonacci level inside a descending channel . The fact that the price tested this level suggests that there may be some support at this level, which could potentially lead to a price reversal.
Currently, the price is forming a pennant pattern below the 4-hour supply level . A pennant pattern is a technical analysis pattern that usually forms after a strong price movement and consists of a series of lower highs and higher lows, converging towards a point. This pattern typically signals a continuation of the previous trend after a breakout from the pattern.
Therefore, if the price breaks out above the pennant pattern and the 4-hour supply level , it could be a signal for traders to go long on the asset. However, it's important to follow Plancton's confirmation rules before taking any trading action.
–––––
Follow the Shrimp 🦐
Keep in mind.
🟣 Purple structure -> Monthly structure.
🔴 Red structure -> Weekly structure.
🔵 Blue structure -> Daily structure.
🟡 Yellow structure -> 4h structure.
⚫️ Black structure -> <= 1h structure.
Follow the Shrimp 🦐

Bitcoin is in bull-market already after the retesting 19.5kBitcoin price will soar up to all time highs after a bull-trap heading to 29.7k and retest 25.2k if it doesn't just plummet from black swan events .
Please be careful while trading.

ATOM: Resistance BreakoutCosmos (ATOM) technical analysis:
Trade setup : Price broke back above down trendline and 200-day moving average, which is bullish and could revisit $16 level. Note that it made a Higher Low, which is also a sign of Uptrend. Upside to $16.
Trend : Neutral on Medium-Term basis and Uptrend on Short- and Long-Term basis.
Momentum is Mixed as MACD Line is above MACD Signal Line (Bullish) but RSI ~ 50 (Neutral).
Support and Resistance : Nearest Support Zone is $12.00, then $10.00. The nearest Resistance Zone is $16.00.

ATOM Idea: The price will rise to the trend line. Then a bearish triple top pattern will form and the price will fall to the $11 zone

An Entry ModelStill yet to fully backtest, Once the market has made a CHOCH to create a new High. Market then comes back to sweep the Liquidities behind the internal low. Sometimes it come to mitigate an OB and that low becomes an Inducement

ATOM/USDTIn my opinion, it is accumulating to break the dynamic resistance. Bitcoin will suffer for a few days and it is the best time for altcoins to rise.

ATOM - To the top of the Monthly RangeI can see ATOM pushing towards $16 although top of the range is around $17
This is valid if ETH/BTC makes a push to the upside which would then equal to an alt rally at least during the weekend, the FOMC will be a good trigger for either the upside or downside depending on what they decide.
