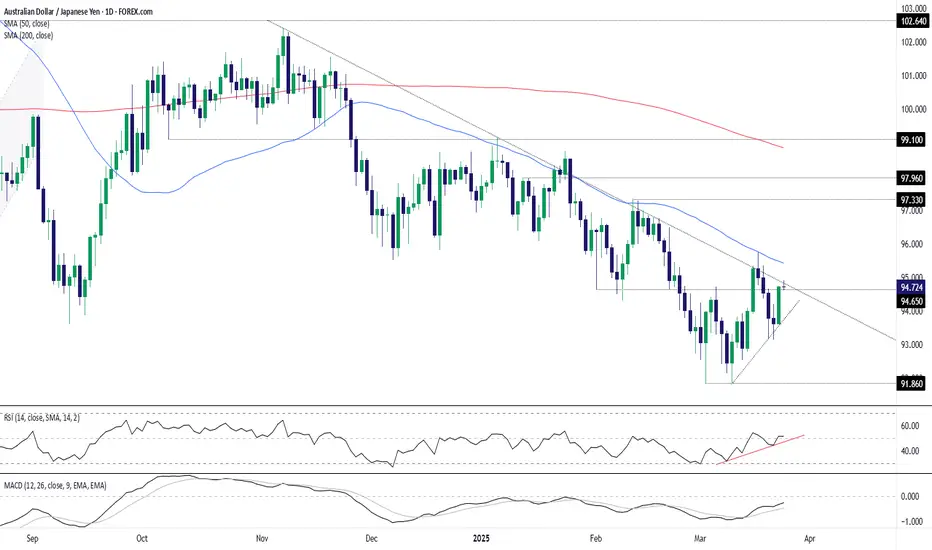
AUD/JPY 1D possible scenario Technical Analysis 1D
The pair is testing a long-term downtrend resistance. A breakout could signal further upside.
Key Levels:
Support: 95.52
Resistance: 98.49 | 102.62 | 109.40
Fundamental Factors:
Australian Dollar Strength: Driven by commodity demand and potential RBA rate decisions.
Japanese Yen Weakness: BoJ’s ultra-loose policy keeps the yen under pressure.
Risk Sentiment: AUD/JPY correlates with market risk appetite; stronger equities could support upside.
A breakout above 95.52 may open the path toward 98.49.
AUDJPY trade ideas

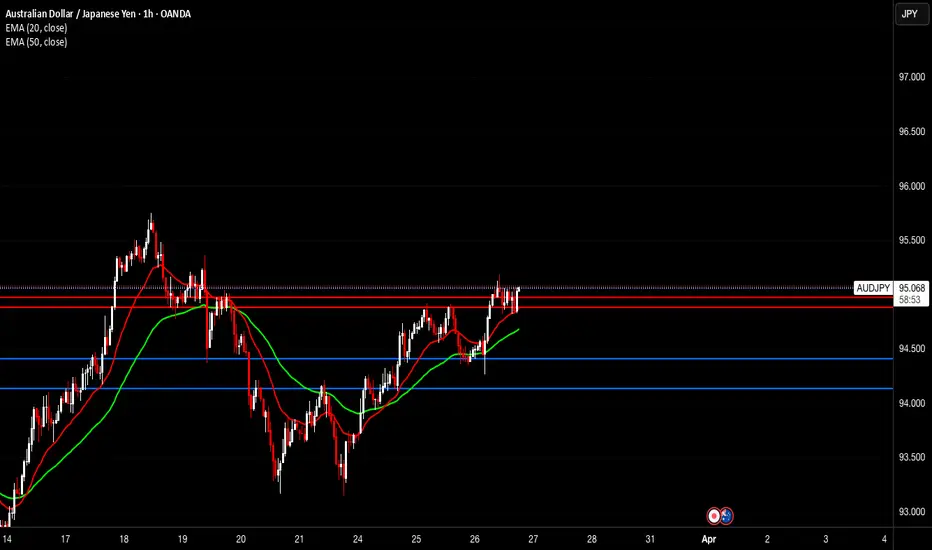
AUDJPY INTRADAY resistance retest at 95.70Key Trading Level: 95.70
Bearish Scenario:
The overall sentiment remains bearish, aligned with the longer-term prevailing downtrend. Recent price action suggests a sideways consolidation, indicating potential continuation of the downtrend. A bearish rejection from 95.70 could reinforce selling pressure, targeting 94.20 as the first support level, with further downside extending toward 93.30 and 92.60 if bearish momentum strengthens.
Bullish Scenario:
A confirmed breakout above 95.70 and a daily close higher would invalidate the bearish outlook, signaling a potential shift in momentum. If buyers gain control, the next upside targets would be 96.20, followed by 96.80, where further resistance may emerge.
Conclusion:
The 95.70 level is a key pivot point in determining AUDJPY’s next directional move. A rejection at this level would reinforce the bearish outlook, while a breakout higher could indicate a potential trend reversal. Traders should monitor price action around 95.70 for confirmation of the next move.
This communication is for informational purposes only and should not be viewed as any form of recommendation as to a particular course of action or as investment advice. It is not intended as an offer or solicitation for the purchase or sale of any financial instrument or as an official confirmation of any transaction. Opinions, estimates and assumptions expressed herein are made as of the date of this communication and are subject to change without notice. This communication has been prepared based upon information, including market prices, data and other information, believed to be reliable; however, Trade Nation does not warrant its completeness or accuracy. All market prices and market data contained in or attached to this communication are indicative and subject to change without notice.

AUDJPY Technical Analysis! SELL!
My dear friends,
Please, find my technical outlook for AUDJPY below:
The instrument tests an important psychological level 95.011
Bias - Bearish
Technical Indicators: Supper Trend gives a precise Bearish signal, while Pivot Point HL predicts price changes and potential reversals in the market.
Target - 94.381
About Used Indicators:
Super-trend indicator is more useful in trending markets where there are clear uptrends and downtrends in price.
Disclosure: I am part of Trade Nation's Influencer program and receive a monthly fee for using their TradingView charts in my analysis.
———————————
WISH YOU ALL LUCK

AUD/JPY For Bullishwait for pull-back near by entry point and then go long
general trend is up trend
JPY is Weak
have fun :)

15 minute trendline breakThe price has broken a 15 minute trendline, followed by a pullback, now the price looks to go bullish after making a higher high
WE ONLY TRADE PULLBACKS

Bullish bounce?AUD/JPY is falling towards the pivot which acts as a pullback support and could bounce to the 1st resistance.
Pivot: 94.04
1st Support: 93.18
1st Resistance: 95.54
Risk Warning:
Trading Forex and CFDs carries a high level of risk to your capital and you should only trade with money you can afford to lose. Trading Forex and CFDs may not be suitable for all investors, so please ensure that you fully understand the risks involved and seek independent advice if necessary.
Disclaimer:
The above opinions given constitute general market commentary, and do not constitute the opinion or advice of IC Markets or any form of personal or investment advice.
Any opinions, news, research, analyses, prices, other information, or links to third-party sites contained on this website are provided on an "as-is" basis, are intended only to be informative, is not an advice nor a recommendation, nor research, or a record of our trading prices, or an offer of, or solicitation for a transaction in any financial instrument and thus should not be treated as such. The information provided does not involve any specific investment objectives, financial situation and needs of any specific person who may receive it. Please be aware, that past performance is not a reliable indicator of future performance and/or results. Past Performance or Forward-looking scenarios based upon the reasonable beliefs of the third-party provider are not a guarantee of future performance. Actual results may differ materially from those anticipated in forward-looking or past performance statements. IC Markets makes no representation or warranty and assumes no liability as to the accuracy or completeness of the information provided, nor any loss arising from any investment based on a recommendation, forecast or any information supplied by any third-party.

AUDJPYPrice is above the weekly zone and has retested on the daily and H4. Was waiting for break above h1 resistance which has happened with a retest. looks ripe for upward movement.
AUD/JPY SELL IDEA (R:R=8.7)Selling AUD/JPY now. I have been waiting for this to close below the trend line. Overall direction is BEARISH according to Monthly timeframe.
Stop Loss is: 95.260
Please move SL to break even when trade is 70+ pips in profit.
1st Target: 93.500
2nd Target: 92.715
Happy Trading! :)

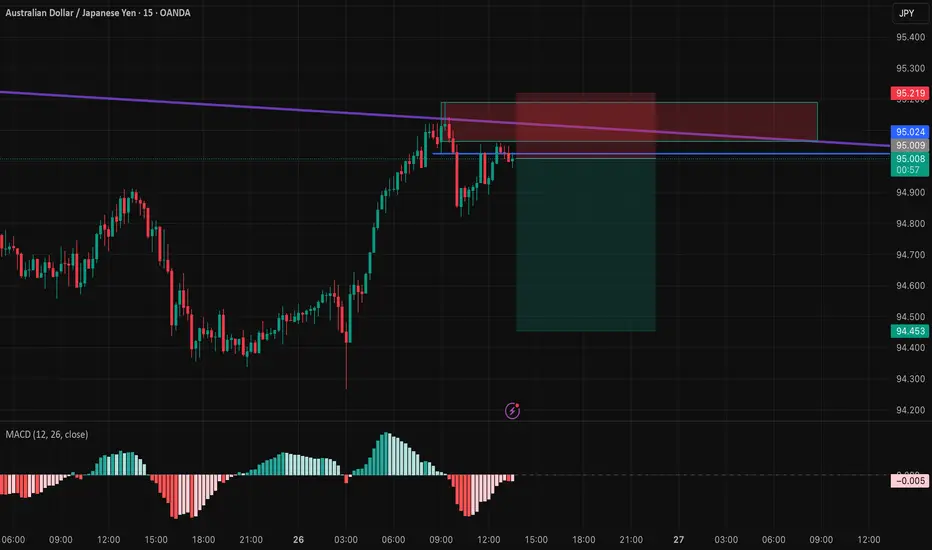
AUDJPY 15 min Short IdeaHello Friends,
AUDJPY is finding resistance and is about to resume its downtrend.
ENTRY = Market Price
SL = 95.22
TP = 94.45
Kindly share your views and please like, share, and follow for more ideas.
Thanks
The Journey has come to an end: AUDJPY hit TP, after 3 dayswe started the journey on Monday, London session, we held it no matter the market conditions.
we believed in our setup and we hit our TP.
cheers to y'all that followed it.
unto the next, let's fvcking goooo!!!

AUDJPY LONGHi traders, watch closely as I forecast the structure, waves and key areas of AJ future price:
Bullish momentum
5 wave phase with internal
5 wave structure
Wait for first impulse to build liquidity
92.000 key level
Please don't forget to like, comment and follow me for me because you won't get exclusive analysis else like this.
Don't forget to follow your trading plan, strategy and psychological aspect!

Long - AUD/JPY Base on the market structure given in the 4 Hour timeframe. A CHOCH has been formed and this would make this pair and interesting one to look at as the price now has reached all 3 fibonacci retracement levels. I believe that this set up is valid and worth to look at.
I will only be participating in the market if there are any reversal confirmations within given zones. As of now price has yet to reached the given zone.

BUY!!! AUDJPY AS SOON AS THE PRICE RETRACTS TO 94,000HELLO TRADERS, I AM VERY INTERESTED IN BUYING THIS AUDJPY PAIR AS SOON AS IT REACHES THE ZONE OF INTEREST AROUND THE PRICE OF 94,000. EVERYTHING INDICATES THAT THE PRICE WILL RISE.
TECHNICAL ANALYSIS
CONFLUENCES AT THE MOMENT
1.- rejection of the last daily structure point
2.- rejection of daily interest zone
3.- rejection of psychological number 94,000
4.- daily rejection candle
why do I like it?
The daily and 4-hour timeframes are bullish, meaning they are in harmony. The most logical thing to do is to buy as soon as the price pulls back to the zone of interest and ride the trend!
Why would I sell if the price is rising?
The price has been rejected at the last structure point (look at the daily candlesticks of March 12, 2025, and March 13, 2025).
The price has been rejected at a daily zone of interest that has been respected repeatedly in the past, which shows us that it is a well-respected support.
The price has tested the psychological number 94,000, which could attract new buyers upon retesting it.
Now that we have the daily and 4-hour timeframes, as I mentioned before, the most logical thing to do is to look for long positions. I'll wait for my target zone to be tested again to open a long position if my entry pattern holds within 30 minutes.
If you like my idea, don't forget to like and follow me. I'll respond to your suggestions and comments! FxAlexisTrader.

AUDJPY in Bullish TREND"After a prominent bullish divergence, the price action has not broken its last lower low. Instead, it has either broken the last lower high or already formed a higher high (HH), indicating potential readiness for the next HH."

AUD/JPY BEARS ARE GAINING STRENGTH|SHORT
Hello, Friends!
AUD/JPY is trending down which is evident from the red colour of the previous weekly candle. However, the price has locally surged into the overbought territory. Which can be told from its proximity to the BB upper band. Which presents a classical trend following opportunity for a short trade from the resistance line above towards the demand level of 93.883.
Disclosure: I am part of Trade Nation's Influencer program and receive a monthly fee for using their TradingView charts in my analysis.
✅LIKE AND COMMENT MY IDEAS✅

AUD/JPY Bulls Take Aim at Key Downtrend ResistanceDowntrend resistance that has thwarted AUD/JPY bulls since November is under attack on Tuesday following the completion of a three-candle morning star pattern. The bullish signal increases the probability of a retest of the equally formidable 50-day moving average, especially with momentum indicators like RSI (14) and MACD skewing higher.
A decisive break of the downtrend creates a setup where longs could be established above with a stop beneath for protection. The 50-day moving average is the key hurdle for bulls to overcome, with a break of that opening the path for a run towards 96.00 or even the February high of 97.33. Should the move fail at the 50DMA, the trade could be nixed or even reversed.
If the price fails to break the downtrend, the bullish setup would be invalidated.
Good luck!
DS
AUDJPY Setupthe entry looks clean in London session, i've been waiting for the opportunity and watching it since the Asian session.
check with ur confirmation.
let's gooo!!

AUD/JPY NEXT MOVESell after bearish candle stick pattern, buy after bullish candle stick pattern....
Best bullish pattern , engulfing candle or green hammer
Best bearish pattern , engulfing candle or red shooting star
NOTE: IF YOU CAN'T SEE ANY OF TOP PATTERN IN THE ZONE DO NOT ENTER
Stop lost before pattern
R/R %1/%3
Trade in 5 Min Timeframe, use signals for scalping

AUD/JPY For Bullishyou can go long now
or
wait for pull-back near entry point and then go long
general trend is up trend
have fun :)

NZDJPY FORERCASTTraders! We are starting again the new trading week! This week is looking good in terms of structure as the price seems like it has reached the potential zones! Today I have NZDJPY On my watch. This pair has reached the value area and we've seen a complete structure, What I only wait is the confirmational entry. Let's look at this with a close aye today!

AUDJPY Downtrend Intact — Eyes on the Next Leg Lower After RetraAUDJPY continues to bleed lower, and the trend shows no sign of slowing. This week’s market open and any gap will reveal whether we get a shallow or deeper retrace — either way, the setup points toward targeting the recent lows, and possibly breaking them.

AUD/JPY 4H chartKey Observations:
Support Zone (Gray Box at ~93.00 Level)
Price recently bounced off this minor support zone, indicating potential buying pressure.
Descending Trendline Resistance (Short-Term Bearish Structure)
Price is still respecting a descending trendline. A confirmed breakout above this trendline could signal further bullish movement.
Key Resistance to Watch: 94.22 - 94.50
The nearest resistance level is around 94.22, marked by previous structure and a potential breakout zone.
Larger Support Zone (~92.50 - Yellow Box)
If price fails to break the descending trendline and drops, the next strong buy area would be around 92.50, a stronger demand zone.
Buying Scenario (Bullish Confirmation)
✅ Entry: Wait for a breakout above the descending trendline and a retest of 93.60 - 93.70.
✅ Target: 94.22 - 94.50 (Short-Term) and 95.50 (Extended Target).
✅ Stop-Loss: Below 92.80 to allow room for volatility.
Risk to Consider (Bearish Rejection)
❌ If price fails to break the trendline, it may drop toward the 92.50 demand zone, offering a better buy entry.

AUDJPY PRINTING REVERSALTechnically:
AUDJPY is printing double bottom
AUDDJPY is printing bullish divergence
