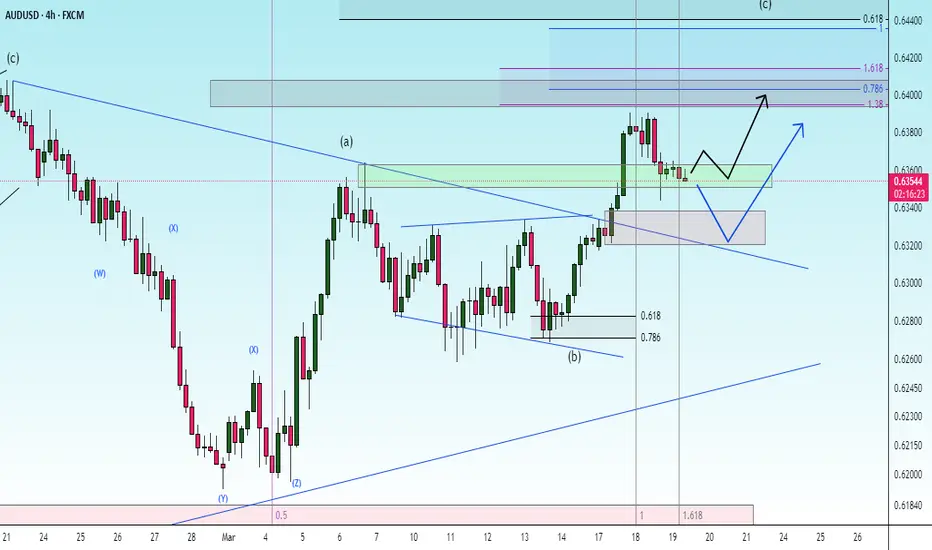
AUDUSD: Pullback From Support 🇦🇺🇺🇸
There is a high chance that AUDUSD will pull back from
the underlined daily support.
As a confirmation, I see a tiny double bottom on an hourly time frame.
Goal - 0.6342
❤️Please, support my work with like, thank you!❤️
I am part of Trade Nation's Influencer program and receive a monthly fee for using their TradingView charts in my analysis.
AUDUSD.1.MINI trade ideas

AUDUSD Will Go Up! Buy!
Please, check our technical outlook for AUDUSD.
Time Frame: 1D
Current Trend: Bullish
Sentiment: Oversold (based on 7-period RSI)
Forecast: Bullish
The market is approaching a key horizontal level 0.632.
Considering the today's price action, probabilities will be high to see a movement to 0.643.
P.S
We determine oversold/overbought condition with RSI indicator.
When it drops below 30 - the market is considered to be oversold.
When it bounces above 70 - the market is considered to be overbought.
Disclosure: I am part of Trade Nation's Influencer program and receive a monthly fee for using their TradingView charts in my analysis.
Like and subscribe and comment my ideas if you enjoy them!

Audusd I posted this trade few days ago and this is the out come , de market is onna down trend so we are expecting more bearish movement

AUD/USDAUD/USD LONG "break of a resistance area and retest it + 50% fib retracement + 50emla dynamic support + trendline"

possibility of uptrendIf the price can change the trend within the current support range, the start of an uptrend is possible. Otherwise, the continuation of the correction to the next support range is possible and then there is a possibility of a trend change within this range.
AUDUSD Head and Shoulders bottom pattern, BUY 0.6330On the daily chart, AUDUSD formed a head and shoulders bottom pattern, with short-term bulls in the lead. Currently, attention can be paid to the support around 0.6330. If it falls back and stabilizes, you can consider buying. The upward target is around 0.6440, and the upper target is around 0.6550.

AUDUSD InsightHello, subscribers! Great to see you all.
Please share your personal opinions in the comments. Don’t forget to like and subscribe!
Key Points
- The German Bundestag passed a constitutional amendment by 513 votes in favor and 207 against, allowing the establishment of a €500 billion special infrastructure fund and easing debt limits.
- U.S. President Donald Trump and Russian President Vladimir Putin agreed to a partial ceasefire, suspending attacks on energy and infrastructure facilities in Ukraine for 30 days.
- With the FOMC meeting taking place, the market's focus is not on the interest rate decision itself but on economic projections, changes in the dot plot, and any signals regarding the end of quantitative tightening (QT).
This Week’s Major Economic Events
+ March 19: Bank of Japan interest rate decision, Eurozone February CPI, FOMC meeting results
+ March 20: Bank of England interest rate decision
AUDUSD Chart Analysis
After previously finding support at the 0.62000 level, AUD/USD is once again attempting to break through resistance at 0.64000. If it successfully breaks above this resistance, the pair may rise toward 0.66000. Conversely, failure to break through could lead to a decline toward 0.60000.

falling towards 50% Fibonacci support?The Aussie (AUD/USD) is falling towards the pivot and could bounce to the 1st resistance which acts as a pullback resistance.
Pivot: 0.6326
1st Support: 0.6274
1st Resistance: 0.6382
Risk Warning:
Trading Forex and CFDs carries a high level of risk to your capital and you should only trade with money you can afford to lose. Trading Forex and CFDs may not be suitable for all investors, so please ensure that you fully understand the risks involved and seek independent advice if necessary.
Disclaimer:
The above opinions given constitute general market commentary, and do not constitute the opinion or advice of IC Markets or any form of personal or investment advice.
Any opinions, news, research, analyses, prices, other information, or links to third-party sites contained on this website are provided on an "as-is" basis, are intended only to be informative, is not an advice nor a recommendation, nor research, or a record of our trading prices, or an offer of, or solicitation for a transaction in any financial instrument and thus should not be treated as such. The information provided does not involve any specific investment objectives, financial situation and needs of any specific person who may receive it. Please be aware, that past performance is not a reliable indicator of future performance and/or results. Past Performance or Forward-looking scenarios based upon the reasonable beliefs of the third-party provider are not a guarantee of future performance. Actual results may differ materially from those anticipated in forward-looking or past performance statements. IC Markets makes no representation or warranty and assumes no liability as to the accuracy or completeness of the information provided, nor any loss arising from any investment based on a recommendation, forecast or any information supplied by any third-party.

AUDUSD 30M TimeFrame SellAUDUSD looking good for a scalp sell with very suitable stoploss
the main idea is risky because the trend is bullish

Falling towards 50% Fibonacci support?AUD/USD is falling towards the support level which is an overlap support that lines up with the 50% Fibonacci retracement and could bounce from this level to our take profit.
Entry: 0.6333
Why we like it:
There is an overlap support level that aligns with the 50% Fibonacci retracement.
Stop loss: 0.6298
Why we like it:
There is a pullback support level that lines up with he 78.6% Fibonacci retracement.
Take profit: 0.6401
Why we like it:}
There is a pullback resistance level.
Enjoying your TradingView experience? Review us!
Please be advised that the information presented on TradingView is provided to Vantage (‘Vantage Global Limited’, ‘we’) by a third-party provider (‘Everest Fortune Group’). Please be reminded that you are solely responsible for the trading decisions on your account. There is a very high degree of risk involved in trading. Any information and/or content is intended entirely for research, educational and informational purposes only and does not constitute investment or consultation advice or investment strategy. The information is not tailored to the investment needs of any specific person and therefore does not involve a consideration of any of the investment objectives, financial situation or needs of any viewer that may receive it. Kindly also note that past performance is not a reliable indicator of future results. Actual results may differ materially from those anticipated in forward-looking or past performance statements. We assume no liability as to the accuracy or completeness of any of the information and/or content provided herein and the Company cannot be held responsible for any omission, mistake nor for any loss or damage including without limitation to any loss of profit which may arise from reliance on any information supplied by Everest Fortune Group.


AUDUSD - ShortPrice has formed double top divergence.
At the breakout of HL, sellers will be in control.
Entry is at the breakout of HL.

Bearish breakout?THE Aussie (AUD/USD is reacting off the resistance level which is a pullback resistance that lines sup with he 161.8% Fibonacci extension and could drop from this level to the downside.

AUD/USD For Bearish as Pull-backyou can go short now
or
wait for entry point and then go short
general trend is up trend
current phase is pull-back
have fun :)

AUDUSD 1H Trade Idea - Continued The AUDUSD pair is showing strong signs of bullish momentum as we anticipate further upside potential. With an overall positive outlook on the Australian Dollar and supportive technical indicators, this pair is poised for a potential rally. Watch for favorable market conditions that could drive the price higher in the coming sessions.

AUDUSD 1H Trade IdeaThe AUDUSD pair is showing strong signs of bullish momentum as we anticipate further upside potential. With an overall positive outlook on the Australian Dollar and supportive technical indicators, this pair is poised for a potential rally. Watch for favorable market conditions that could drive the price higher in the coming sessions.

Heading into 61.8% Fibonacci resistance?AUD/USD is rising towards the resistance level which is a pullback resistance that is slightly below the 61.8% Fibonacci retracement and could reverse from this level to our take profit.
Entry: 0.6441
Why we like it:
There is a pullback resistance level that is slightly below the 61.8% Fibonacci retracement.
Stop loss: 0.6536
Why we like it:
There is an overlap resistance level that lines up with the 161.8% Fibonacci retracement.
Take profit: 0.6276
Why we like it:
There is a pullback support level.
Enjoying your TradingView experience? Review us!
Please be advised that the information presented on TradingView is provided to Vantage (‘Vantage Global Limited’, ‘we’) by a third-party provider (‘Everest Fortune Group’). Please be reminded that you are solely responsible for the trading decisions on your account. There is a very high degree of risk involved in trading. Any information and/or content is intended entirely for research, educational and informational purposes only and does not constitute investment or consultation advice or investment strategy. The information is not tailored to the investment needs of any specific person and therefore does not involve a consideration of any of the investment objectives, financial situation or needs of any viewer that may receive it. Kindly also note that past performance is not a reliable indicator of future results. Actual results may differ materially from those anticipated in forward-looking or past performance statements. We assume no liability as to the accuracy or completeness of any of the information and/or content provided herein and the Company cannot be held responsible for any omission, mistake nor for any loss or damage including without limitation to any loss of profit which may arise from reliance on any information supplied by Everest Fortune Group.

AUDUSD Wave Analysis – 17 March 2025
- AUDUSD broke resistance level 0.6350
- Likely to rise to resistance level 0.6400
AUDUSD currency pair today broke the resistance level 0.6350, which is the top of the previous upward correction from the start of this month.
The breakout of the resistance level 0.6350 was preceded by the breakout of the resistance trendline from September – which accelerated the active impulse wave c.
Given the strongly bearish US dollar sentiment seen today, AUDUSD currency pair can be expected to rise to the next resistance level 0.6400.

AUDUSD: Short Signal with Entry/SL/TP
AUDUSD
- Classic bearish pattern
- Our team expects retracement
SUGGESTED TRADE:
Swing Trade
Sell AUDUSD
Entry - 0.6373
Stop - 0.6418
Take - 0.6300
Our Risk - 1%
Start protection of your profits from lower levels
Disclosure: I am part of Trade Nation's Influencer program and receive a monthly fee for using their TradingView charts in my analysis.
❤️ Please, support our work with like & comment! ❤️

AUD Could Gain Momentum if 0.636 BreaksA potential channel formation is developing, and AUD is searching for new highs within an ABC structure on the daily timeframe. The target is around 0.65.
If 0.636 fails to break, a correction could offer a good entry opportunity. Watch for confirmation signals. 📈🔍

AUDUSDIt is now going to be bullish when it breaks the previous high.
No divergence
bullish Rectangle
Symmetrical Triangle

DeGRAM | AUDUSD broke through the trend lineAUDUSD is in an ascending channel above the trend lines.
The price is moving from the lower boundary of the channel and 50% retracement level.
The chart has broken the upper trend line and resistance level.
We expect the growth to continue.
-------------------
Share your opinion in the comments and support the idea with like. Thanks for your support!

AUDUSD up ? This is what i see in markets , if anyone else have different opinion please comment down below.
USD is weak now and now could be right time to buy all currencies against USD
Be aware of classic Monday dump !
GL Traders
Not advice !
