AVAX, the flattening? Elliott waveIf you find this information inspiring/helpful, please consider a boost and follow! Any questions or comments, please leave a comment!
Same levels on watch since last update,
when it pivoted at AOI. 🧵
I see a 3 wave move up, but honestly,
doesn't matter.
Many variations would benefit from at least one more low.
$38 break and flip needed.
$26-$22 AOI if lower atm.
AVAXUSDT.P trade ideas

AVAX-USDT | 4H | TECHNICAL CHARTHello traders, AVAX has completed its first 5 waves, and now it's time for the completion of the ABC wave. Right after the completion of wave C, I combined harmonic patterns and made an analysis of both. I marked my target with yellow arrows on the chart after the completion of the harmonic pattern.
If you want me to keep my analysis up to date, please don't forget to like this post.
Thank you for considering my analysis and perspective.

AVAXUSDTBINANCE:AVAXUSDT
the tools that were used for this analysis is
1 fib wedge
2 Elliott Triple combo
3 OB
4 head & shoulders Patterns
Plus price action

AVAX BTFD? 42024Im constantly scouring all assets. I see a potential setup for AVAX trade. Its corrected about 50 percent off its highs. WIll late buyers step in? are we being overly cautious and should be backing up the truck throwing all our money in? not quite. but there a possibility that AVAX does what it always does. Rallies off this zone and destroys shorters and deniers. Then later traps in again late buyers. Possible rally coming. COuld also lose so be careful no one knows exactly but going off of history. ONce we hold this level. Fireworks set off
Possible GOD CANDLE

Avalanche (AVAX) to $380Price action has corrected 80% since the sell signal last November as is shown on the above 2-day chart. A number of reasons now exist to be long, including:
1) The ‘incredible buy’ signal.
2) Both price action and RSI resistance have broken out (1-day chart below)
3) Regular bullish divergence (1-day chart below).
4) Both points 2 and 3 are also true for the BTC pair (below).
5) The target is a measured Fibonacci move to the 1.618 as it was with the last cycle.
Is it possible price action falls further? Sure.
Is it probable? No.
Good luck!
Ww
Type: trade
Risk: <6% of portfolio
Duration: 1 - 3 months
Return: 15x
1-day chart
1-day BTC pair


AVAX USDT fri 12 apr '24 20:30! fri 12 apr '24 20:30! fri 12 apr '24 20:30! fri 12 apr '24 20:30! fri 12 apr '24 20:30! fri 12 apr '24 20:30! fri 12 apr '24 20:30! fri 12 apr '24 20:30! fri 12 apr '24 20:30! fri 12 apr '24 20:30! fri 12 apr '24 20:30! fri 12 apr '24 20:30! fri 12 apr '24 20:30! fri 12 apr '24 20:30! fri 12 apr '24 20:30! fri 12 apr '24 20:30! fri 12 apr '24 20:30! fri 12 apr '24 20:30! fri 12 apr '24 20:30! fri 12 apr '24 20:30! fri 12 apr '24 20:30!

AVAXUSDI am expecting AVAX to reach below Jan 1 marked price low, fill the Monthly FVG (Gap), then proceed to buy up to 50$ High and Above.

🏔️💰 AVAX Long Trade Opportunity! 🚀📈📊 Analysis:
Support Retracement: AVAX is currently at the $32.00 - $35.00 support level.
Entry Point: Consider entering a long spot trade within this support range.
Profit Targets: Aim for $40.00 - $45.00 or $50.00 - $53.00 resistance levels.
Risk Management: Set a tight stop-loss just below $32.00.
📈 Trading Strategy:
Entry: Long trade initiated within the $32.00 - $35.00 support range.
Targets: Take profits at identified resistance levels.
Risk Control: Maintain discipline with the stop-loss.
🚨 Note: Monitor the market closely for any changes in price action! 📊🔍 #AVAX #LongTrade #CryptoAnalysis 🎯💱

Another correction before bullishThe safest way in investment is DCA strategy. This is suggestion zone for you to DCA .
Not financial advisor

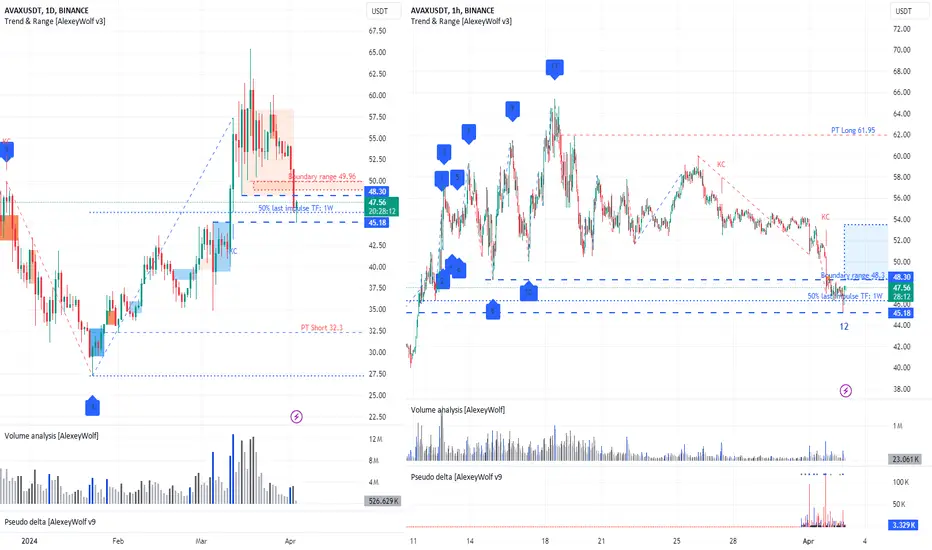
AVAXUSDT. Looking for salesHello traders and investors!
On the daily timeframe, we observe a sideways trend. The buyer's vector 4-5 has played out. The price is at the upper boundary of the sideways trend, and we can consider looking for sales as an idea to implement the seller's vector 5-6 with the first target at 40.07 (then 34.83, 32.3). After the previous review, we notice a strong resumption of the seller from the upper boundary of the sideways trend at 49.96. I anticipate that the price will test the local minimum of 44.97.
On the daily timeframe, we also see a sideways trend. The current seller's vector is 8-9 with the first target at 45.17.
It's preferable to look for sales from the upper boundary of the sideways trend on the hourly timeframe, ideally from the seller's protection level at 48.17. Alternatively, look for sales below the level of 44.97 in the absence of buyers there.

AVAX → Avalanche Reached Resistance! Reverse to $25? or $75?AVAX has met a major 2021 lifetime resistance area and rendered a strong sell signal in response. Is this the time to short?
How do we trade this? 🤔
We have three pushes up in a bull trend; the third push has made contact with a major 2021 resistance area, followed by two strong bear candles closing on their lows below the Daily 30EMA. What we need now is a test of the 30EMA as resistance followed by a strong bear bar closing on or near its low. This will be our confirmation bar and our queue to enter a short. Take half profits at 1:1 Risk/Reward then move the stop loss up to the entry price to secure profits. Swing the latter half of the position to 1:3 Risk/Reward just above the previous major support, or until a reversal pattern appears.
💡 Trade Idea 💡
Short Entry: $46.50
🟥 Stop Loss: $53.00
✅ Take Profit #1: $39.85
✅ Take Profit #2: $27.00
⚖️ Risk/Reward Ratio: 1:3
🔑 Key Takeaways 🔑
1. Three pushes up into a bull trend.
2. Price has made contact with a 2021 resistance area.
3. Strong sell signal pushing below the Daily 30EMA
4. Wait for confirmation candle just below the Daily 30EMA to enter a short.
5. RSI at 48.00 and below the Moving Average, supports short bias.
💰 Trading Tip 💰
It's reasonable to take half profits at the first resistance target in a long trade, or the first support target in a short trade. Using a 1:1 Risk/Reward Ratio for your first target, you can move your stop loss up to your entry price, locking in profits. This allows you to watch the rest of the trade execute without worry of losing money. This helps improve trading psychology and the equity in your account.
⚠️ Risk Warning! ⚠️
Past performance is not necessarily indicative of future results. You are solely responsible for your trades. Trade at your own risk!
Like 👍 and Follow to learn more about:
1. Reading Price Action
2. Chart Analysis
3. Trade Management
4. Trading Psychology

Avalanche(AVAX): Cup&Handle = Getting Ready For Breakdown!Avalanche has formed a nice Cup&Handle pattern here, with price teasing that neckline zone.
Not to keep it long, all is clear; we wait for a breakdown, and then we will enter.
Swallow Team

AVAX - SHAKEOUT before FINAL ATH📉Hi Traders, Investors and Speculators of Charts📈
AVAXUSDT, an ETH rival, is another altcoin currently trading lower than it's first ATH. This is important, because it makes for an excellent low risk and high reward trade.
Currently, we see the markets trading in a corrective phase where wicky price action and shakeouts are common.
I've been bullish on AVAX for a very long time, and we've seen great increases since my last update:
If you found this content helpful, please remember to hit like and subscribe and never miss a moment in the markets.
_______________________
📢Follow us here on TradingView for daily updates📢
👍Hit like & Follow 👍
CryptoCheck
BINANCE:AVAXUSDT

I think its doing Drop Base RallyThis is not a financial idea or something. Im just learning ICT concepts and testing. Do not use this chart

Lingrid | AVAXUSDT potential short from the Daily RESISTANCEThe price of BINANCE:AVAXUSDT has been making lower lows in the downward channel. The market made a consolidation zone, then broke through it. On the weekly timeframe, it's approaching the demand zone. I think the market might move below the round level at 40.00; take liquidity below it, then move upward. On the daily timeframe, we have a slightly different picture. The price is testing the strong support level at 40.00–41.00. My goal is the support level at 40.00.
Traders, if you liked this idea or if you have your own opinion about it, write in the comments. I will be glad 👩💻

AVAX It is Moving Towards The Supply ZoneSupply & Demand Zone This Time is Very Important.
The Intersection of The Gray & Red Areas Is An Important Place

AVAX USDTAs we see there is a correction on AVAX and we are now on very important level 0.5 Fibonacci, we will retest the bearish OB to fill the fvg and the price will fall to 0.618 fibo at 42usdt, then I will update you with evrythink traders.
support me by comment and follow love you.
Don't forget to have good risk management because the cryptocurrency market is very volatile.

AVAX - Let's the avalanche roll big!AVAX - seem to be out of his long term dormitory phase,
This coins has always had great potential.. But people now start to buy it.
It is painting a VCP pattern which is broken up, leading to paint the other secondary leg giving to the coin a bullish momentum.
We have some targets and one of them is round 145$ if the volume and the trend become/stay consistent.
What do you think?
Good trading!

AVAX-Trade PlanAVAX USDT pair is currently range bound. It can give opportunity in either direction. Both trade plan with prope risk mangement are shared.

#AVX AVAX holding onto this strong UTA trading idea for the crypto space, to buy AVAXUSDT between $44 and $47, stop loss as a move under $43, with a target of $68.
If buying at current levels you are risking $4 to make potentially $21 so not a bad risk/reward on the trade. March the 5th highs at 44.36 were respected and held on the 5th of April, so i don't really want to see price below there, but i will give it space to 43 just so it doesn't wick us out. There was some decent volume traded under $43 so i think thats fine as a stop loss. On the upside the recent swing high at $50 needs to break which should then bring on some momentum to the upside.

AVAUSDT. We have context for both selling and buying. It's an interesting situation. We have context for both selling and buying.
On the daily timeframe, there's a sideways movement (upper boundary - 49.96). The price has now returned to it, but the daily candle has not yet closed. If the daily candle closes inside the sideways movement, then we can look for sales, and the bearish vector 5-6 with a target at 32.3 will be relevant. There are two threats for the bears along the way in the form of buyer zones (blue background). The first one is at 48.3, which is currently being interacted with. The second threat is the buyer zone with the upper boundary at 45.18.
On the hourly timeframe, the price is at the lower boundary of the sideways movement (48.3). The bearish vector 11-12 has played out. The launch of the bullish vector 12-13 with a target at 61.95 is possible.
In summary, the daily and hourly buyer levels coincide (48.3). If the buyer shows itself at this level, then we can consider buying, taking into account the seller zones on the daily chart (red background). If the seller defends the breakout of the level 48.3, then we can consider selling, taking into account the daily buyer zone (upper boundary 45.18), inside which, by the way, lies 50% of the last daily buyer impulse.
For a more detailed explanation of how to read charts and consider different timeframes when looking for trades, you can refer to the article
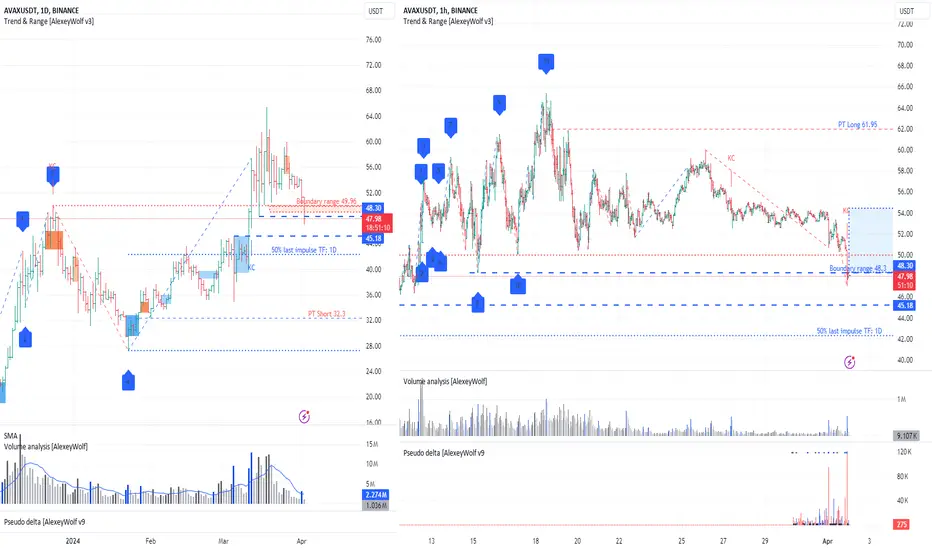
AVAXUSDT. On the Daily timeframe, selling takes precedenceOn the daily timeframe, we see a sideways movement with the upper boundary at 49.96. The price has been above the upper boundary for the last 20 days, but yesterday it returned to it and stopped at the 50% level of the last buyer's impulse on the weekly timeframe. This is clearly visible on the hourly timeframe:
At the top, a seller's zone has formed with the upper boundary at 48.3 (red background), and at the bottom, a buyer's zone with the upper boundary at 45.18 (blue background). I anticipate price interaction with the seller's zone of interest. If the seller defends the range of 48-50, we can consider the possibility of sales, and the bearish vector 5-6 will become relevant with a target at 32.3. However, on the way to this target, sellers may be hindered by the buyer's zone, with which there was just interaction and a bullish reaction began, as clearly seen on the hourly timeframe.
On the hourly timeframe, the price is below the lower boundary of the sideways movement at the level of 48.3. The bearish vector 11-12 has already played out, and we can expect the launch of the bullish vector 12-13 with an ambitious target at the level of 61.95 (ambitious, because the buyer will have to overcome the seller's zone on the daily timeframe). To launch the bullish vector, the buyer needs to raise the price above the range of 48-50 and protect it.
For a more detailed explanation of how to read charts and consider different timeframes when looking for trades, you can refer to the article