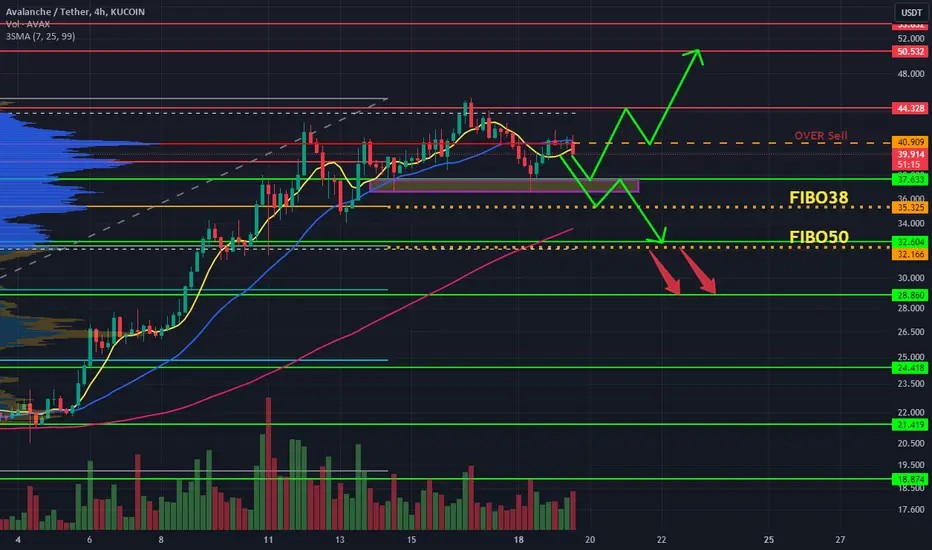
AVAXUSDT4-hour time form AVAX analysis
The price is now 39.5$. According to the over sell area, it is expected that the support of 37.6 will decrease, and since the support in this area is strong, the price may return to higher levels and the price is 50.5$. Our main support It is 50 in Fibonacci. If this area is lost, we will witness a heavy fall.
Technical analyst: Amir Hassan Salek
#AVAXUSDT
AVAXUSDT.P trade ideas
avalanche to 235🚀 AVAX: Potential for $235 in 1.5 Years 🚀
1️⃣ Current Status: AVAX at $41.28.
2️⃣ Avalanche Ecosystem: Unique consensus, positive momentum.
3️⃣ Market Trends: Resilient, poised for growth.
4️⃣ Ecosystem Developments: Expanding with projects and partnerships.
5️⃣ Technological Advancements: Avalanche consensus sets it apart.
6️⃣ Tokenomics: Capped supply, rising demand.
7️⃣ Bullish Projection: AVAX could hit $235 in 1.5 years.
8️⃣ Risks: Stay informed about market dynamics.
🌌 AVAX's journey has just begun. Get ready for exciting times ahead! 🚀

AVAX → Avalanche Reversal Imminent!? The Tipping Point is Near.Avalanche (AVAX) is burning red hot on the charts and flirting with the idea of a reversal. Do we have the justification to short here? Or will the trend continue upward?
How do we trade this? 🤔
AVAX has three pushes up in this trend, three sell bars near the $44.00 level, and an RSI level of 82.00 and below the Moving Average. These are all signs that a trend change is coming in the near future and at the very least, entering a long position here is not justified.
It is reasonable however to capture some of the downward price action with the correct indicators. We need break below the bull channel support around the Daily 30EMA with a strong bear bar closing on or near its low. Followed by a retest of the channel support as resistance to confirm that the bull trend is over. At this time, its reasonable to scalp a short at 1:1 Risk/Reward around the $31.00 level, stop loss at $37.00, and take profit at $25.00.
It is also reasonable to go for a 1:2 Risk/Reward down to $19.00 after moving your stop loss up to your entry price and taking half profits at 1:1 Risk/Reward.
Until then it's wise to remain on the sidelines and wait for the correct signals to enter the market.
💡 Trade Ideas 💡
Short Entry: $31.00
🟥 Stop Loss: $37.00
✅ Take Profit: $19.00
⚖️ Risk/Reward Ratio: 1:2
🔑 Key Takeaways 🔑
1. Bull Channel, Bias to Long!
2. Three Pushes up in Trend with Sell signal, Signal to Change Trend.
3. Gap to Second Push Support Line.
4. RSI at 82.00 and below Moving Average, Strong Bias to Short
5. Wait for Short Confirmation bar before entering a position.
💰 Trading Tip 💰
Probability that the price will go the direction of the trend is low at the beginning (swing trade) and end (late scalp) of a trend. Proportion your position size, risk (stop loss placement), and reward (take profit placement) to the probability of profit at your entry price.
⚠️ Risk Warning! ⚠️
Past performance is not necessarily indicative of future results. You are solely responsible for your trades. Trade at your own risk!
Like 👍 and comment if you found this analysis useful!

Avax USDT ShortAVAX USDT SHORT
Entry when H1 candle close under 38.44
Reason is that we broke the trendline, and trading below it,
Theres a Possible retest of that trendline to confirm bearish move, then if we see a break of structure and closure below 38.44 then we go short down to the liquidity levels
TP1 38
TP2 37
TP3 36
TP4 35
TP5 34
SL 46 (we might adjust SL later on)
Leverage 10x

#AVAX AVALANCHE A BIT LOWER TO GOAVALANCHE is going to 34.25 area, if this resists, we may have a bounce.
I do think we will have the following configuration:
- BTC down
- AVAX to $34.25
- Small bounce to $34
- Straight to 32 on a trend line

AVAX Rests on Key Support, Will It Break Out or Break Down?BINANCE:AVAXUSDT managed to surpass the resistance level at $37.15 within the last few days. Following this breakthrough, its price has been experiencing a consolidation phase. However, it appears that traders are currently selling off their AVAX holdings as the coin approaches a support level.
If AVAX fails to maintain a daily closing price above $37.15 within the next 48 hours, it could potentially decline to as low as $27 in the coming week. Conversely, if AVAX manages to stay above the $37.15 mark, there is a possibility of the cryptocurrency's price ascending towards the resistance level of $52.60 in the short term.
The technical indicators observed on AVAX's daily chart suggest a potential price drop in the upcoming days. Both the Moving Average Convergence Divergence (MACD) and the Relative Strength Index (RSI) indicators are currently displaying bearish signals.
The MACD line is approaching the MACD signal line, which could indicate a reversal towards a bearish trend for AVAX if these two lines intersect. Additionally, the RSI line recently dipped below the RSI Simple Moving Average (SMA) line in the past few days, signaling that sellers are gaining an advantage over buyers.

✅ 80$ As Midterm Target For AVAX👉 In My View AVAX Corrective Move Completed And New Bullish Wave Started From 9$ Area ,Currently The Price Playing Below The Important Trend Line,Once We Reclaim 25$ It Will My Main Buy Trigger For Midterm

Avax #avax downstream thoughts Could be happen ...
Ascending dynamic line breakout and a pull to it ...
Sencondary flipping on yellow level

⚡️AVAXUSDT CMC TRADING ⚡️ LQ GRAB ENTRY MODELIn AVAXUSDT, there has been a successful capture of Liquidity (LQ) above the point of interest, surpassing the prior high established on the left side. Subsequently, there is a retracement inside indicated by ChoCh, forming a Former Value Gap (FVG) or Imbalance on the corresponding Order Block (OB). Our anticipation involves a retracement, tagging in, and subsequently filling the FVG for an opportune short entry.

Avax to Supply Area?I usually Don't trade in this coin.
But as volatility is there and it gives me a setup and trigger.
Possibly can go to Supply area around 50 now.
Longed 41.800
Stoploss 41.300
Trade Type: Risky
Note: Not a Financial Advice.

#avax #avalanche will come the valuesAvax will reach these blue values in the short term and we will see both bull and bear.

Avalanche ($AVAX) Surges 400% in Two MonthsAvalanche (AVAX) outperforms majority of large-caps, jumps to pre-LUNA-collapse levels.
After a marvelous 30% upsurge last week, AVAX replaced Dogecoin (DOGE) as the ninth largest cryptocurrency asset.
Its upsurge is driven by a combination of long-term and short-term catalysts as AVAX outperforms almost all large-cap altcoins.
Avalanche (AVAX) price rally expands The price of Avalanche (AVAX), the core native asset of the eponymous blockchain network, set a new local high at $44 on major spot exchanges today, Dec. 16, 2023. Last time AVAX was so expensive on May 8, 2022, before the ecosystem of Terra/Luna collapsed. As such, today marks an 83-week high for the AVAX price.
Last week, AVAX became the fastest-growing altcoin in the top 20 of the largest assets; in the top 30 of CoinMarketCap it was only surpassed by Internet Computer (ICP). In the last 24 hours, $4.88 million of AVAX positions, mostly shorts, were liquidated. The largest single liquidation was registered on OKX in an AVAX-USDT short and exceeded $128,000 in equivalent.
In the last two months, the total value locked (TVL) in Avalanche-based decentralized finance (DeFi) protocols almost doubled: It soared from $487 million to $949 million. Benqi, Trader Joe, Aave and GMX are the largest and fastest-growing DeFis in the ecosystem.


AVAX - ShortGood luck to everyone! This analysis is for educational purposes only and does not constitute financial advice. Conduct your own analysis before making trading decisions.

#AVAXUSDT (WATCHLIST) 10-2023!#AVAXUSDT
Project category: Layer 1 blockchain protocol
Avalanche is a decentralized platform for launching finance applications and enterprise blockchain deployments. It provides high throughput, low latency, and low-cost transactions. Avalanche is also highly scalable and can support a large number of users and applications.
Market cap: $3,745,090,955 USD (as of October 26, 2023)
Coin supply: 355,017,520 AVAX
Max supply: 720,000,000 AVAX
AVAX is the native token of the Avalanche network and is used for staking, paying transaction fees, and accessing dApps on the network.
AVAX is currently ranked #20 by market capitalization on CoinMarketCap.
Add to your watchlist
When we suggest adding a coin to your watchlist, it means it's forming a pattern or approaching a historical bottom, near or above a good support level, displaying increased trading volume, showing a reversal candle, in an accumulation stage, etc. However, we haven't seen any bullish reaction yet, so we recommend adding it to your watchlist until the right time for entry.
Note:
This isn't financial advice, but an analysis of coin movement (not a buy or sell signal). Before following any ideas, do your own research and practice good risk management.
Remember, the cryptocurrency market is highly volatile and involves both gains and losses. Understand the risks before investing.
Good luck to everyone, and we hope that Allah reconciles and repays us all. 🙏

$53 WE GO $AVAX The goal remains $53 for me before any shakeout. Of course it depends of Sir. Bitcoin, however if Bitcoin stays calm, CRYPTOCAP:AVAX is promised to a $53 before any clear resistance.

AVAX: Resistance BreakoutTrade setup : Bullish break above $35 signaled continuation of uptrend. However, price is now very overbought (RSI ~ 90) and we’re likely to see it pause here on some profit taking.
Trend : Uptrend across all time horizons (Short- Medium- and Long-Term).
Momentum is Bullish but extremely overbought. ( MACD Line is above MACD Signal Line). RSI is bullish (> 55) but extremely overbought (> 80) which could imply that price could briefly pause or pull back if it reaches Resistance.
Support and Resistance : Nearest Support Zone is $35 (previous resistance), then $25. The nearest Resistance Zone is $50.

Entry clear, but my favorite exit is half of a big wickThe AVAXUSDT trade is still on but if there i a strong pullack the exit will be at a rally to a prior 50% level of a daily chandles wick

AVAXUSDT - SHORTAVAXUSDT.P is showing Bearish Divergence, followed by a Head & Shoulder pattern, which strengthens the indication of a potential trend reversal from bullish to bearish.

AVAX - Overvalued relative to alternatives?Traders might start taking profits at the first indication of bearish power equality and move their funds to similar alternatives like ATOM and DOT which haven't (yet?) experienced the runup of AVAX.
Recent large ranges indicate this is already occurring.

Where is the destination of AVAX✅⁉️
🔴AVAX is poised to explode after a 130% surge in the last 3 months. Are you ready🔍👀
🔴Note: All white lines are PRZs, which are generated based on x.y.z.🎗️
🎗️AVAX to reach all-time high and surprise us?🌪️

AVAX at strong historical resistance. Time to short?Avax price is at strong historical (2021) resistance on the weekly chart. Rsi is in the high oversold area.
On the daily chart the volume is dropping for six days and the price can't break 42ish resistance (bearish divergance). Also the Rsi is above 90 on the daily chart.
My opinion is it needs to cool down before another jump.

Avax price at strong historical resistance. Time to short?Avax price is at strong historical resistance on the weekly chart. Rsi is in the high oversold area. On the daily chart the volume is dropping and the price can't break 42ish resistance on the several candles. Rsi above 90 on the daily chart. My opinion is it needs to cool down before another jump.
What are your ideas for the rise continuation if so?
