AXLUSDT 1D#AXL has broken above the falling wedge resistance and the MA50 on the daily chart. If it manages to keep the price above the MA50, the targets are:
🎯 $0.4209
🎯 $0.4755
🎯 $0.5431
🎯 $0.6025
🎯 $0.7051
⚠️ Use a tight stop-loss.

AXLUSDT 1D AnalysisAXL ~ 1D Analysis
#AXL Managed to penetrate this resistant line and is currently trying to maintain it. As long as the price is above this S/R line, bullish can still encourage prices.
Trading opportunity for AXLUSDT AxelarBased on technical factors there is a Buy position in :
📊 AXLUSDT
🔵 Buy Now or by Breakout
🪫Stop loss 0.3600
🔋Target 0.4950
📏 R/R 2,5
💸RISK : 1%
We hope it is profitable for you ❤️
Please support our activity with your likes👍 and comments📝

Massive pump incomingWaiting for breakout here , giga bullish 🔥 , symetrical triangle
goodluck , dyor 🔥

#AXL/USDT#AXL
The price is moving within a descending channel on the 1-hour frame, adhering well to it, and is heading for a strong breakout and retest.
We are experiencing a rebound from the lower boundary of the descending channel, which is support at 0.3360.
We are experiencing a downtrend on the RSI in

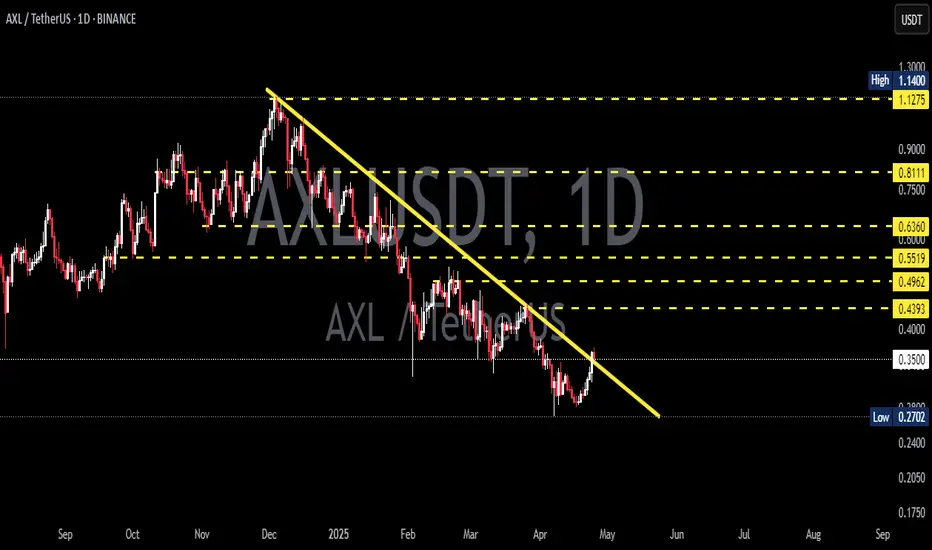
AXLUSDT 1DAXL ~ 1D Analysis
#AXL High risk trading, Buy after successfully penetrating this resistant line or buy after successfully testing this support block. with a short -term target of at least 10%+.

AXLUSDT 2DAXL ~ 2D Analysis
#AXL Test this support, buy from here if you still have a Conviction on this Coin with a minimum target of 15%+

#XAL/USDT #XAL
The price is moving in a descending channel on the 1-hour frame and is adhering to it well and is heading to break it strongly upwards
We have a bounce from the lower limit of the descending channel, this support is at a price of 0.6090
We have a downtrend on the RSI indicator that is about

#AXL/USDT#AXL
The price is moving within a bearish channel pattern on the 4-hour frame, which is a strong retracement pattern
We have a bounce from a major support area in green at 0.5000
We have a tendency to stabilize above the Moving Average 100
We have a downtrend on the RSI indicator that supports t

AXLUSDT 8H#AXL is moving within a falling wedge. Keep an eye on it. In case of a breakout above the 8H MA100 and pattern resistance, the targets are:
🎯 $0.7698
🎯 $0.8405
🎯 $0.9112
🎯 $1.0118
🎯 $1.1400

See all ideas
Summarizing what the indicators are suggesting.
Oscillators
Neutral
SellBuy
Strong sellStrong buy
Strong sellSellNeutralBuyStrong buy
Oscillators
Neutral
SellBuy
Strong sellStrong buy
Strong sellSellNeutralBuyStrong buy
Summary
Neutral
SellBuy
Strong sellStrong buy
Strong sellSellNeutralBuyStrong buy
Summary
Neutral
SellBuy
Strong sellStrong buy
Strong sellSellNeutralBuyStrong buy
Summary
Neutral
SellBuy
Strong sellStrong buy
Strong sellSellNeutralBuyStrong buy
Moving Averages
Neutral
SellBuy
Strong sellStrong buy
Strong sellSellNeutralBuyStrong buy
Moving Averages
Neutral
SellBuy
Strong sellStrong buy
Strong sellSellNeutralBuyStrong buy
Displays a symbol's price movements over previous years to identify recurring trends.