Huge Sell Opportunity What's good TRADINGVIEW family, I spotted a profitable Bearish Candle on (August 20, 2022), that has the potential for a 46.02% return on investment. (Here are my 3 reasons)
*This bearish candle has these 4 principles - 1. The (RED MA) is above the bearish candle and (BLUE EMA), 2. The Bearish Candle has a flat top, 3. The Bearish Candle is below the Ichimoku cloud, 4. The previous wick of this Bearish Candle is greater than the last bearish previous wick.
2. This Bearish Candle has 4 effective indicators which increase the probability of a successful sell trade
3. This Bearish Candle has 3 advantages over the last bearish candle
1st Advantage = The (RSI INDICATOR) ON THIS BEARISH CANDLE IS LOWER THAN THE LAST BEARISH RSI (5), BY 2
2nd Advantage = The (DMI INDICATOR) ON THIS BEARISH CANDLE IS GREATER THAN THE LAST BEARISH DMI (94), BY 4
3rd Advantage = The PREVIOUS WICK OF THIS BEARISH CANDLE IS GREATER THAN THE LAST BEARISH PREVIOUS WICK (5), BY 6
*2 RESISTANCE LEVELS - WHICH THE PRICE OF AXS HAS RESPECTED THAT WILL PROTECT THE PRICE FROM HITTING MY (S.L)
(SHORT POSITION)
Entry Price: $14.78
Stop Loss: $15.92
Take Profit: $8.34
Position Size: $200 (invested)
Buomkuoth Reath - August 29, 2022 - 9:05pm
AXSUSDT.P trade ideas

🔥 AXS Classic Bear Flag Break Out: Wait for Confirmation!With BTC dropping, its to be expected that alts will follow.
AXS is one of the weakest alts of the last couple of months, so the expectation is it will continue the bearish trend.
After breaking out of the bear flag, AXS has one more obstacle to clear before we can move down, which is the purple Area of support.
A daily close below this area will most likely be the starting signal for more bearish price action. Be patient for the break out. Targets placed at $10 and $9.

AXSUSD LONGPossible upward movement of the pair. Price is currently in the trading zone with significant volume holding a significant stop near the pivotal 55 period EMA in my trend continuation analysis strategy. I see a pattern known in my strategy as the ABC pattern, which indicates a range close to the EMA, for a possible continuation of the uptrend, in this case, through its wave C, which matches from my strategy with a it comes from the price to the 55 period EMA on the bounce on the 4-hour chart. We see the accompanying indicators such as the Squeeze Histogram of Momentum and MACD with bullish directionality accompanied by the loss of strength of the previous move higher in robot, indicated by the ADX below the 23 level. We see a possible selling pattern in the MACD lines. In one-hour timeframes we see important rejections close to the 55 period Ema, also being in a trading zone with significant volume and possible buy signal patterns. I think it is quite possible to move higher on a break of the previous highs and continue its trend. You will see the development of the pattern and the confirmation of the trend change to up.

AXS shortAXS bounced off the resistance area. Asset broke trough off the ascending trendline. Bearish movement to support level at 13.53 is possible.

Axie Infinity `` RR/1.6xLooking forward to a SHORT.
rejection from resistance, with candlestick pattern


AXS/USDT Soon will be good to joinHey Colleagues,
Today we came across AXS /USDT again. We see that four last Daily candles have been telling us about some big movement,. Risk is big so thats why we set stop so close!! But the outcome could be very sweet. We think that price should reach $18.75 so that it would try top break that zone there!!
If you like ideas provided by our team you can show us your support by liking and commenting.
Yours Sincerely,
Swallow Team 🔱
Disclamer:
We are not financial advisors. The content that we share on this website are for educational purposes and are our own personal opinions.


Falling WedgeFalling wedge with bullish divergence. Declining volume, Bounced off 20 EMA. Green cup and handle/bull flag breakout with a measured move to $15.01

AXS (Analysis)Hello, dear TradingView members.
AXS was downtrend last week. After several attempts by buyers to break the resistance of $19, the price hit a higher resistance at $20. Due to breaking the resistance of the $19 range, the buyers tried to turn this resistance into support. But it was immediately accompanied by selling pressure, and the trend reversal started at $20.
The support range drawn on the chart at the price of 13.5 to 14.1 dollars has been associated with a good reaction, but you should note that if it returns to the top, it is possible to reduce the price again. More important support is drawn in the chart's $11-12 range. In case of increasing selling pressure, there is a possibility of price reduction to this range. Ichimoku indicator lines can also show the price of $16.5 as resistance. Therefore, the current week's price trend can be between these ranges.
Good luck!

AXSUSDT is testing the 0.618 Fibonacci LevelThe price is testing the key support on 15.60$ area where the market has 0.618 Fibonacci level.
On the daily timeframe, the price created a double top on 20$ area.
How to approach it?
IF the price is going to lose the support and retest as new resistance, According to Plancton's strategy , we can set a nice order
–––––
Keep in mind.
🟣 Purple structure -> Monthly structure.
🔴 Red structure -> Weekly structure.
🔵 Blue structure -> Daily structure.
🟡 Yellow structure -> 4h structure.
–––––
Follow the Shrimp 🦐

AXS/USDT second buy trade setupPreviously we had a buy setup for AXS. Right now it seems that we'll have another downside swing. So sharing an alternative buy signal.

AXS\USDT 👦Adam and Eve👧🇺🇸Hello friends👋.
📈Long: 5-10% of deposit
🔴SL: $16.19
🟢TP: 23.91$
The figure of Adam and Eve has formed, pay attention to how much this instrument was bought back when the price fell below the level, there could be a good growth, long!📈
If you liked the idea, I will be grateful for the likes and comments!

Cup and Handle/ Falling WedgeMultiple bullish patterns, falling wedges, cup and handle, bullish divergence, exaggerated divergence on other time frames. Most stochastic rsi time frames are oversold but the 1hr, wait for that to reset. Macd about to cross bullish.

Is AXS going to skyrocket soon❓Hi friends! AXS was a top gainer of 2021 and even in this market conditions make +70% from it's bottom.
Actually it`s look like a big accumulation range at the bottom and now we can see the exit out of this range. As you know, breakout of the range is leading to the pump of crypto so we shouldn't miss this movement.
ADA had the same base and now it`s on the way to my targets. Subscribe and check the previous ideas!
The big guys buy this alt at the bottom as you can see at the volume indicator.
📊 Here are the preconditions to open a long:
🔥 squeeze to the $20-22 value area
🔥 whales orders to buy which DOM and Footprint indicators show
🔥 possible trap (shake out) to collect long traders sl
🔥 bullish BTC help ETH to reach all the targets
The max-min profit for this movement at least +20-60% but it`s not even the long term target.
📊 The targets:
1. $22.7 - key level, you can close here 30-40% of long and fix profit+set sl at breakeven
2. $28.5-30 - value area, closest resistance and even number
💻Friends, press the "boost"🚀 button, write comments and share with your friends - it will be the best THANK YOU.
P.S. Personally, I open an entry if the price shows it according to my strategy.
Always do your analysis before making a trade.

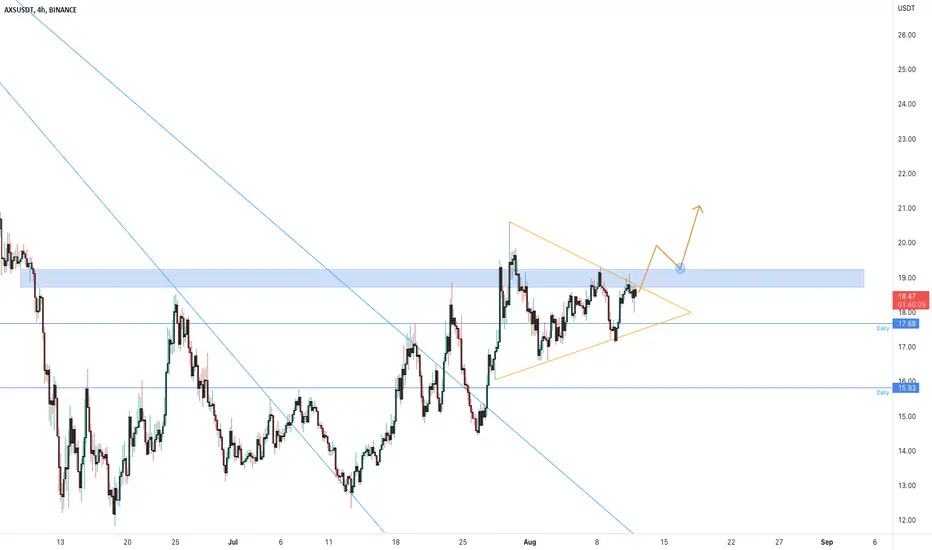
AXSUSDT is creating a daily pennant 🦐The price is testing the daily resistance at 19$ area where the price created a false breakout as well.
The price is creating a pennant below the main structure
How to approach it?
IF and only IF the price is going to have a breakout from the daily resistance and retest it as new support, According to Plancton's strategy , we can set a nice order
–––––
Keep in mind.
🟣 Purple structure -> Monthly structure.
🔴 Red structure -> Weekly structure.
🔵 Blue structure -> Daily structure.
🟡 Yellow structure -> 4h structure.
–––––
Follow the Shrimp 🦐
💡Don't miss the great buy opportunity in AXSUSD @AxieInfinity
Trading suggestion:
". There is a possibility of temporary retracement to the suggested support line (16.34).
. if so, traders can set orders based on Price Action and expect to reach short-term targets."
Technical analysis:
. AXSUSDT is in a range bound, and the beginning of an uptrend is expected.
. The price is above the 21-Day WEMA, which acts as a dynamic support.
. The RSI is at 64.
Take Profits:
TP1= @ 17.69
TP2= @ 18.53
TP3= @ 19.58
TP4= @ 21.60
TP5= @ 23.56
SL= Break below S2
❤️ If you find this helpful and want more FREE forecasts in TradingView
. . . . . Please show your support back,
. . . . . . . . Hit the 👍 LIKE button,
. . . . . . . . . . Drop some feedback below in the comment!
❤️ Your support is very much 🙏 appreciated! ❤️
💎 Want us to help you become a better Forex / Crypto trader ?
Now, It's your turn !
Be sure to leave a comment; let us know how you see this opportunity and forecast.
Trade well, ❤️
ForecastCity English Support Team ❤️

AXS/USDT important level to be approached!Hey colleagues ,
Another coin that looks interesting to us is AXS. We see how nice of a pattern we have formed here with Higher-Lows in making - we see a clear flag pattern here! As it is getting tighter in pattern so does our time to decide where we should move from here so we have two scenarios at the moment.
Firstly - We should break from $19 Resistance and have a little struggle there but overall we should move after that to $23.
Secondly - firstly we breakdown to $16.8 where we should witness a small kind of correction and then go to $15.5.
If you like ideas provided by our team you can show us your support by liking and commenting.
Yours Sincerely,
Swallow Team 🔱
Disclamer:
We are not financial advisors. The content that we share on this website are for educational purposes and are our own personal opinions.

AXSUSDT (Short)AXSUSDT is showing bearish divergence on MACD on 4 hourly chart with price action rounding off, bullish trendline is broken and price action is making LHs.
Short on bearish engulfing @ 18.34
TPs are based on previous strong support zones:
- TP1 - 17.09
- TP2 - 16.31
- TP3 - 15.53

Bull Flag/Cup and HandleI see a bull flag in white, and cup and handle in green. Price is currently backtesting the bull flag/falling wedge (from the cup and handle.) Slight hidden bullish divergence with the RSI and price. MACD may turn light red then have a bullish cross. Daily MACD did just have a bearish cross and daily SRSI is coming down. So do keep that in mind.

AXS/USDTA low number of players means a low demand for AXS
As a quick refresher, AXS serves as a payment token within the Axie Infinity game ecosystem, allowing players to purchase non-fungible tokens (NFTs), in this case the digital pets we all know as "Axies."
It also acts as a utility token that players can spend to breed new Axies.
New users entering the Axie Infinity ecosystem need 3 Axies to take on other Axies. When they win, the platform rewards them with another native token, called Smooth Love Potion (SLP) while winning bigger tournaments earns them AXS.
Consequently, old Axie Infinity players rely on new ones to keep up the demand for Axies.
Otherwise, they could risk former players selling their SLP and AXS earnings on the markets (e.g. cryptocurrency exchanges), thus adding downward pressure to their prices.
But when native Axie Infinity token prices go down, it also makes the game less attractive to new players, who would still need to buy 3 Axies in order to earn SLP and AXS, only now they would be worth less.
The Axie Infinity ecosystem has gone through stages, as mentioned above, in 2022, with its player count falling to 8,950 in June from 63,240 in January, a drop of almost 85%, according to data provided by Dapp Radar. Interestingly, this coincides with the 80% drop in the price of AXS in the same period.
Inflation rising
New inflation data has further curbed bullish bets on major cryptocurrencies, which, one way or another, fuels the bearish outlook for AXS.
In particular, the US consumer price index (CPI) rose at an annual rate of 8.6% in May, compared to 8.3% in the previous month, accentuating investor fears that the Federal Reserve will be forced to raise interest rates aggressively in the coming months, which would push risky assets down across the board.
