AXIE INFINITY! THE $50 SUPPORT LEVEL WORKED OUT.Since November 2021, we have seen most cryptos and altcoins, even Bitcoin concede downtrend movements..
Price has continued to move to the downside here on AXS, but the support level at $50 has been holding strong so far.. We've seen price bounce multiple times from this key level.
Would we see a bullish rally?
Well, we might want to wait for uptrend structures to confirm a bullish rally. But we must understand that "buying the dip" is important at this time.
The all-time high is priced around $163, so picking up AXSUSDT here at $50-$60 is really reallyyyyyy cheap, basically at a discounted price.. I'm long on AXS. I'll be waiting for a new ATH.
AXSUSDT.PS trade ideas

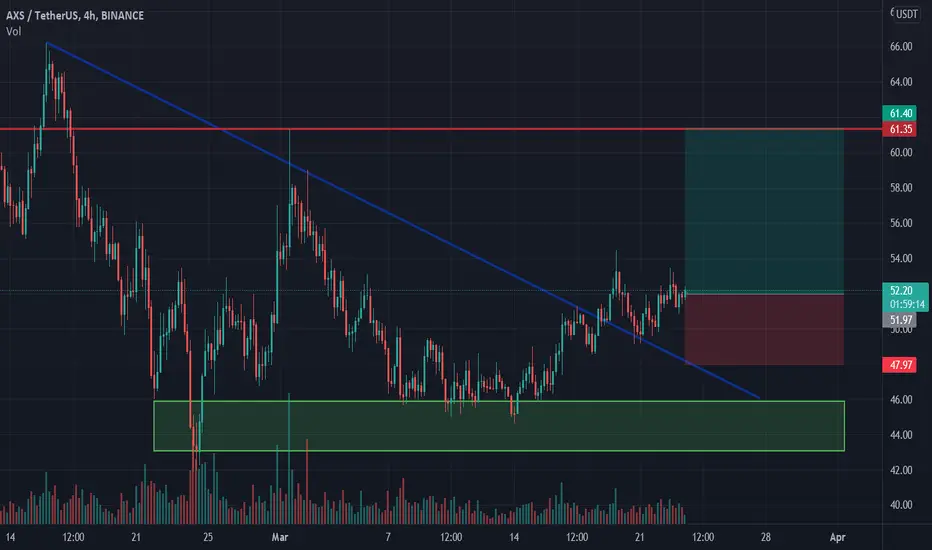
Axie Infinity longAxie Infinity bounced off the support area. Asset broke trough off the descending trendline. Bullish movement to resistance level at 61.35 is possible.
$AXS is gaining momentumAxie Infinity Season 20 is Over. The prize pool to be distributed to players is 117, 676 AXS. Currently, the circulating supply is 77, 242, 770 (28.6%) of the total supply 270m. By the end of December 2022, the expected circulating supply will reach 151, 807, 500 AXS (56.23%) 2 times that of current on circulation. Just how much this would add to the value of Axie Infinity ecosystem?

AXSUSDT LONGHello traders, according to my graphical analysis of AXSUSDT , i prospect an upward trend .
thank you for watching the analysis, it will be great when you support it with a like, follow me for more market analysis .

The falling tend is broken, our direction is up.AXS broke RSI and retested it and turned its direction up, it has not broken its rising trend down yet, which is a positive situation for us. Indicators herald the coming of bulls. After breaking the RSI in June last year, it had risen from $4 to $80... I expect it to rise again with this breakout, although it's not that big.
There is a correlation between AXS and SLP, they rise and fall at the same time. You can follow my opinion about SLP with the link I will leave below. Can you tell me what you see missing in my opinion or your appreciation by commenting, your ideas are important to me. If you like my idea, don't forget to like it and check out my other ideas. Be good to yourself.
It is not investment advice.

Axie, can we get a taxi to the moon?!Hi!
Axie's daily chart shows us that a nice
CURVED TRENDLINE pushes down the price everytime.
This time OBV has made a ascending triangle on 4H time frame and its getting ready for a breakout. Will it help axie to breakout its CURVED TRENDLINE and take us to the moon?!
Thanks
**this is not a financial advice and as alway DYOR!

AXS is currently undervaluedThe AXS from ATH has dropped by 300%, compared to the ETH by 160%. With the current trend, it is now preparing for reversal following ETH.
Not Financial Advice (DYOR)

AXSUSDT 4H: Possible LONGAXSUSDT 4H: Possible LONG
On the 4H chart, after breaking through the level of 52.00, a short-term movement and price growth towards the targets 62 and 73 is possible.


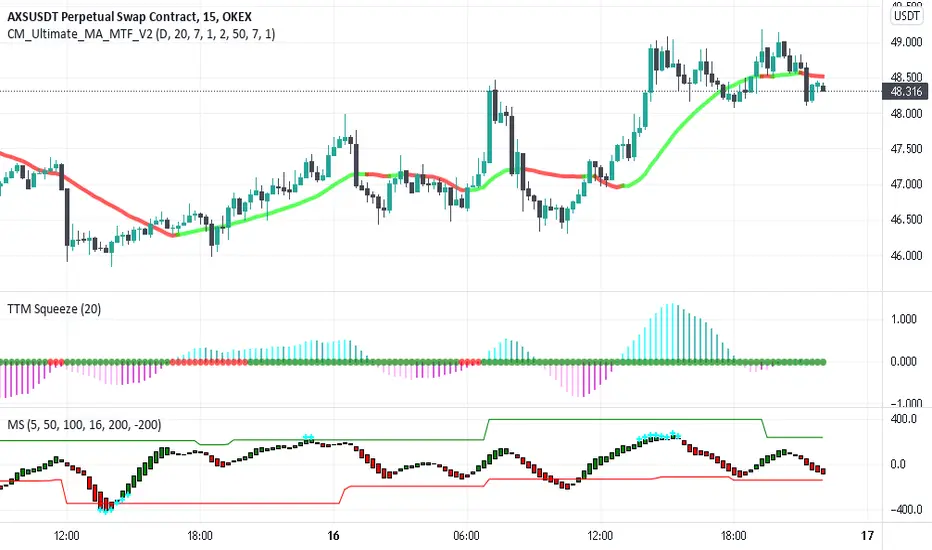
symmetrical triangleAxie infinity has broken my down trendline on D1 TF, it has done a valid retracement and now forming a symmdtric triangle on my 15M TF, a bullish breakout will indicate a rally to my next resistance....keep in mind what BTc is doing.

AXS only for risk takersWaiting for reversal here... there might be some bounce 30-70%. This one is risky because if green support break down... we can see lower prices...smaller position here.
NOT FINANCIAL ADVICE
POSTING ONLY FOR EDUCATIONAL PURPOSE

AXS breakout longPrice has been holding long term daily support floor. Had a downtrend line that was broken to the upside 2 days ago and has been holding it and daily 20 ema line as support. Price had broke out on the 4h chart and has been forming flag. 2h and 1h charts are seeing bullish divergence on stoch as price is respecting a new short term uptrend line. Price had a 38% retracement from lows. Have bullish bias on total market for near term, this is a hedge to my short positions

⚠️HIGHRISK⚠️ Short term Analysis LONG AXS/USDTENTRY; Now on Current Market Price
Take Profit Targets:
1) 48.35
2) 48.81
3) 49.25
4) 49.34
5) 50.00
6) 50.12
Stop Loss: 47.25


axs and qm pattern formationHello friends
Due to the condition of the axes and the formation of the qm pattern, there is a possibility of falling to the specified area
This is a personal opinion and is not a buy or sell offer

AXS/USDT 1HrGOT BREAKOUT AT 1HR CANDLE FOrmed SYMMETRIC TRIANGLE .Lets if the candle close 1hr with good volume we can long this Trades.(ITS NOT FINANCIAL ADVISE ONLY FOR EDUCATIONAL PURPOSE)

Trading strategy for AXSUSDT .Trading strategy for AXSUSDT .
This strategy utilizes fear and greed index at alternative.me
Why Measure Fear and Greed?
The crypto market behavior is very emotional. People tend to get greedy when the market is rising which results in FOMO (Fear of missing out). Also, people often sell their coins in irrational reaction of seeing red numbers. With our Fear and Greed Index, we try to save you from your own emotional overreactions. There are two simple assumptions:
Extreme fear can be a sign that investors are too worried. That could be a buying opportunity.
When Investors are getting too greedy, that means the market is due for a correction.
Therefore, we analyze the current sentiment of the Bitcoin market and crunch the numbers into a simple meter from 0 to 100. Zero means "Extreme Fear", while 100 means "Extreme Greed". See below for further information on our data sources.
UNDERSTANDING THE METRICS AT TRADING VIEW
Maximum Drawdown
The maximum drawdown metric refers to the "worst-case scenario" for a trading period. It measures the greatest distance, or loss, from a previous equity peak.5
What is a Good Profit Factor?
Any ratio greater than one means we can earn more than we lose. So, technically:
A factor higher than 1 denotes a winning system.
A factor lower than 1 denotes a losing system.
Percent Profitable
The percent profitable metric is also known as the probability of winning. This metric is calculated by dividing the number of winning trades by the total number of trades for a specified period.
See profit report below.

AXSUSDT | Long/BuyMy Argument:
1. zig-zag correction is over
2. Hit the support
3. try to make an impulsive wave
4. RSI Divergence
5. Fib 76.40%
SL 47.14
TP1 65.00
TP2 89.5


AXS/USDT DailyHI traders i wish u high profits and don't be panicking because of this kinda range market..
We are in the daily time frame.I think The price has test the support area . We expect it to rise up again and hit the next resistance zone . If this resistance zone is broken, it will go higher and if the support zone is broken, it will go lower.
Warning: This is just a suggestion and I do not guarantee profits. I advise you to analyze the chart before opening any positions.
#Support #Fibbonacci #AXS/USDT
