BAND just wanna be FREE BAND usdt pair update/ you can see the previous analysis in my room...
after many reaction on weekly support after close above the red box band can be a king
the king of kings
its not a signal for buy or sell positions
please search your self
BANDUSDT.P trade ideas


BANDUSDTBAND ~ 1W
#BAND This is an important support block that needs to be maintained.
If you have Conviction on this coin,. This support block would be a very good buy for now.

Trade Signal: BANDUSDT Pair MovementDear Traders,
We have identified a potential trading opportunity for the BANDUSDT pair using the EASY Quantum Ai strategy. Our analysis suggests a Sell direction with the entry price set at 1.229 . This signal is supported by a combination of technical indicators and market conditions.
Reasoning Behind the Signal:
1. Trend Analysis: Recent charts illustrate a downtrend in the BANDUSDT pair, with consistent lower highs indicating bearish momentum.
2. Volume Indicators: Decrease in trading volume during upward movements suggests weakening buying pressure, reinforcing a bearish outlook.
3. Resistance Levels: Historical resistance around the 1.25 level acts as a barrier, making it a challenge for the pair to sustain upward movement.
4. Market Sentiment: Current sentiment analysis reveals a shift towards selling pressure among traders, further supporting the downward trend.
Your Take Profit is strategically positioned at 1.2 to capture potential profit within the expected movement range. To manage risk, set your Stop Loss at 1.263 , providing a safety net to limit potential losses.
Please consider your individual risk tolerance and market conditions before entering the trade.
Happy Trading!

Alikze »» BAND | Descending channel failure🔍 Technical analysis: Descending channel failure
- It has been moving in a downward channel on the daily time frame.
- It is currently in the supply zone with the breakdown of the descending channel.
- In case of a pullback to the broken structure and maintaining the 1.17 area, it can continue its growth until the next supply area of the 1.75-1.95 range.
In addition, in case of failure of the supply zone of 1.75-1.95 range, the upward movement will continue towards the next supply zone, which can touch the 2.60 range.
💎 Alternative scenario: In addition, if the 1.17 range is broken down, the bullish scenario will be invalidated and can continue the correction up to the 0.97 area.
»»»«««»»»«««»»»«««
Please support this idea with a LIKE and COMMENT if you find it useful and Click "Follow" on our profile if you'd like these trade ideas delivered straight to your email in the future.
Thanks for your continued support.
Best Regards,❤️
Alikze.
»»»«««»»»«««»»»«««
BINANCE:BANDUSDT

BANDUSDT Elliott Wave BreakdownIn this video, we conduct an in-depth analysis of BANDUSDT, examining its price action across multiple timeframes. By applying Elliott Wave theory, we aim to map out the potential future price movements and identify key turning points in the market. Additionally, we integrate insights from the Smart Money Concepts indicator, which provides us with a clearer understanding of market dynamics and potential zones of interest. This comprehensive approach allows us to develop a well-rounded trading strategy for BANDUSDT, balancing both short-term and long-term perspectives.

BAND is ready to shortttt!!! Follow me BAND is ready to start its decline after pullback to the broken trend line, be sure to keep in mind that this trade with specified stop can give a good reward.
Tank you for boost me

BANDUSDT 300% Potential!BANDUSDT Technical analysis update
BAND's price is bouncing from its major support zone after repeatedly testing the $1.00 support level. It has been trading in the $1.00-$2.50 range for the past 820 days, and a strong bullish move from the current level is anticipated.
Buy zone : Below $1.07
Stop loss : $0.87
Regards
Hexa

BAND/USDT 1H Chart: Bearish Harmonic and Rising wedge patternBAND/USDT is displaying a bearish harmonic pattern on the 1-hour chart, with the price potentially targeting the marked order block in the red area. The completion of the harmonic pattern at point D suggests a possible reversal zone. Watch for price action around this level for potential short opportunities.

BAND/USDT 1H Chart: Bearish Harmonic and Rising wedge patternBAND/USDT is displaying a bearish harmonic pattern on the 1-hour chart, with the price potentially targeting the marked order block in the red area. The completion of the harmonic pattern at point D suggests a possible reversal zone. Watch for price action around this level for potential short opportunities.

BANDUSDTWe can attempt to buy BANDUSDT from specified level if it break LH , also bullish divergence occur indicate that it moves upward.
SL , TP mention in chart.

BAND looks bearishFrom where we placed the red arrow on the chart, it looks like a BAND correction has started.
BAND seems to be forming a complex diametric which is now in the middle of wave E.
We are looking for sell/short positions in the supply range.
Closing a daily candle above the invalidation level will violate the analysis.
For risk management, please don't forget stop loss and capital management
When we reach the first target, save some profit and then change the stop to entry
Comment if you have any questions
Thank You

BANDUSDT is BullishPrice has given a breakout from the downtrend, and has printed a couple of higher highs indicating that bulls are in complete control of the price action. With no divergence on RSI, the bullish trend is likely to continue as per Dow theory. Targets are mentioned on the chart.

BANDUSDT LONG ✉️ Pair: BANDUSDT
📈 Direction: Long
💯 Leverage: Cross 5X - 10X - 20X
📊 Entry 1: 1.550
📊 Entry 2 (DCA): 1.000
✅ Target 1: 2.000
✅ Target 2: 2.500
✅ Target 3: 3.000
⛔️ Stop Loss: 0.950
BAND Analysis:
Previously, #BANDUSDT has been trading within a descending channel on the 1D timeframe. #BAND has broken out of the descending channel and retested the breakout zone. This pattern is often a precursor to a bullish run. Currently, #BANDUSDT is testing a significant resistance level. A break above this could propel the price toward the upper supply zone, with a target around the strong resistance at $2.5.
If the $1.5 support fails, the next major support to watch is $1.0. This area is crucial, packed with liquidity, and could spark a bullish rally if tested.
Entry Strategy:
- Main entry: 1.550
- Additional entry (DCA): 1.000
Monitor volume and breakout confirmations closely. If #BAND breaks above the resistance level with good volume, it is likely to reach the specified resistance levels.
"Manage your risk – never trade with more than 1% of your capital on a single transaction."
DON`T FORGET TO BOOST US :D

BANDUSDT Bullish momentum - get ready for continue upward!Yello, Paradisers! Is #BANDUSDT poised for a significant move upward ? Let's break down the analysis.
💎#BAND has successfully reclaimed support and broken out of its descending pattern. Currently, the price looks to rebound after retesting this support, with a high probability of continuing upward to challenge the resistance at $1.85. A decisive breakout above this resistance could signal a significant upward move, shifting the trend back to bullish momentum and potentially reaching our target strong resistance area.
💎However, if BAND fails to break this resistance, we might see a retest of the support line. In a bearish scenario, a downward move could bring BAND to the demand zone around $1.108.
💎BAND has a strong history at key support levels. In previous instances, whenever the price hit this zone, it rebounded and moved upward. A bounce from this strong demand area would validate the bullish momentum. Conversely, failure to hold this level would invalidate the bullish outlook, increasing the probability of a downward dip.
Remember, consistency and patience are the keys to long-term success in the crypto market.
MyCryptoParadise
iFeel the success🌴

BAND is bandBAND in weekly tmf
we saw after any touch on floor band price move up ...
we wait for break red trend line and previous high ...
im expect a sharp rally for it
its not a signal for buy/sell orders
its just an idea so please search yourself and have the best...
cheers

BANDUSDT 1WBAND ~ 1W
#BAND Must defend this support block, To stop the price decline.
Defending this support block, Bulls will be in control. losing this support Price will visit the nearest support that we have marked

BANDUSDT 1DKeep an eye on the #BAND daily chart. It has formed a falling wedge and can pump at any time. In case of a breakout, the targets are:
$1.351
$1.638
$1.871
$2.101

$BAND - Roadmap 2024NASDAQ:BAND Roadmap for the rest of this year before completed the Wave C.
Now, BAND is on th Wave C (correction mode) and of this correction has probably started and we can expect it expands to 2025 and probably around $0.3, we can look for new low risk buy setups in Weekly time Frame.

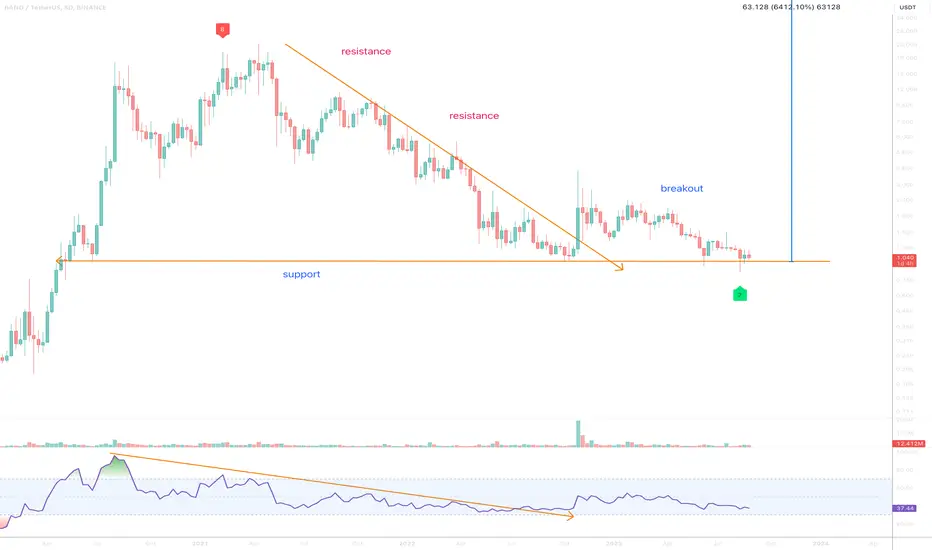
Band Protocol (BAND) - Bullish divergence** Trading opportunity **
On the above 8-day chart price action has corrected 95% since April 2021. A number of reasons now exist to be long, including:
1) Price action and RSI resistance breakouts.
2) Regular bullish divergence. Seven Oscillators print positive divergence with price action over the last 3 to 4 months.
3) Support and resistance, price is on strong historical support, look left.
Is it possible price action continues to correct? Yes.
Is it probable? No.
Ww
Type: trade
Risk: <= 6%
Timeframe: Act now
Return: 50x
Band#BAND
Getting some momentum on the support of falling Wedge in 1D.
Bounce expecting breakout with a bullish wave towards $2.5 in midterm !!!

BAND Key LevelsBand Key Levels Band Key Levels Band Key Levels Band Key Levels Band Key Levels Band Key Levels Band Key Levels Band Key Levels

Opportunity to buy in BANDWe have a bullish iCH on the chart and the trigger line has also broken out.
On the demand range, we can look for buy/long positions
The targets are clear on the chart.
Closing a candle below the invalidation level will violate the analysis
Note that the financial market is risky, so:
Do not enter any position without confirmation and trigger.
Do not enter a position without setting a stop.
Do not enter a position without capital management.
When we reach the first TP, save some profit and try to move the stop continuously in the direction of your profit.
If you have any comments please post them, comments will help us improve our performance
Thanks
