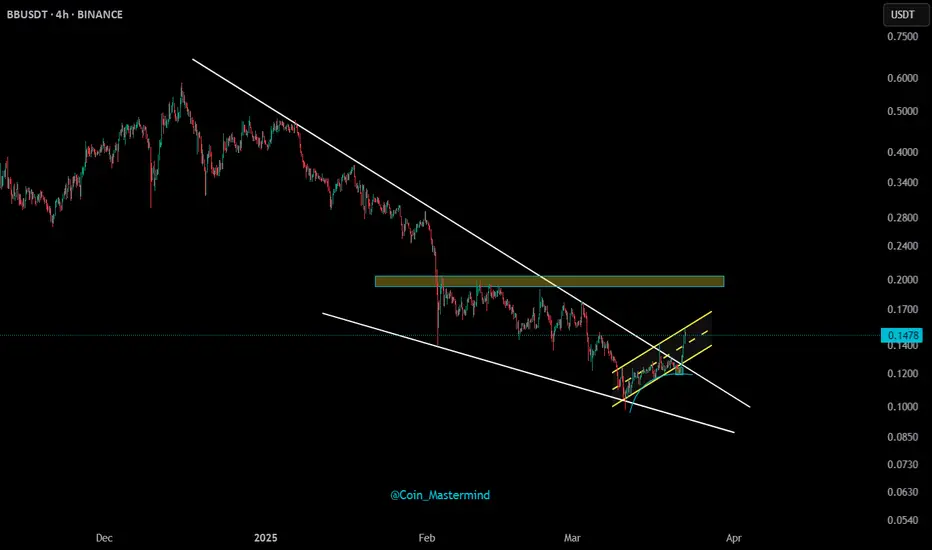
BBUSDTmy entry on this trade idea is taken from a point of interest below an inducement (X).. I extended my stoploss area to cover for the whole swing as price can target the liquidity there before going as I anticipate.. just a trade idea, not financial advise
Entry; $0.1074
Take Profit; $0.1432
Stop

$BB Market Update📊 BB Market Update
BB is forming a Cup with Handle pattern — a classic bullish continuation setup.
📈 If we break out above the black resistance line, we could see a strong move toward the green target zones.
📌 Plan: Watch for confirmation of breakout before entering long.

BB/USDTKey Level Zone: 0.14150 - 0.14450
HMT v7 detected. The setup looks promising, supported by a previous upward/downward trend with increasing volume and momentum, presenting an excellent reward-to-risk opportunity.
HMT (High Momentum Trending):
HMT is based on trend, momentum, volume, and market str

$BB analysis🚀 NYSE:BB Analysis
📊 4H Timeframe:
📈 Ascending Parallel Channel – Currently testing the upper trendline resistance at $0.1550.
📊 Daily Timeframe:
✅ Falling Wedge Breakout – Resulted in a 14% pump.
⚡ Key Scenarios to Watch:
🔼 Bullish Case: A breakout above $0.155 could push price tow
BBUSDT – Blue Box Support, Red Box Resistance! “Key levels in play—will buyers defend, or will resistance hold strong?”
🔥 Key Insights:
✅ Blue Box = Support Zone – If buyers step in, it’s a great reaction area.
✅ Red Box = Resistance Zone – A breakout or rejection will decide the next move.
✅ LTF Breakouts & CDV Confirmations Are a Must – No c

BBUSDT 4H#BB is testing the Ichimoku cloud on the 4H timeframe. In case of a successful bounce, we expect it will break above the trendline. Here are the targets:
🎯 $0.2021
🎯 $0.2188
🎯 $0.2354
🎯 $0.2591
🎯 $0.2893

BBUSDT UPDATEBBUSDT is a cryptocurrency trading at $0.1729. Its target price is $0.3500, indicating a potential 100%+ gain. The pattern is a Bullish Falling Wedge, a reversal pattern signaling a trend change. This pattern suggests the downward trend may be ending. A breakout from the wedge could lead to a strong

BounceBit Gearing for a 5x – Are You Ready?Price action on the weekly and daily charts has been incredibly clean, with steady accumulation since the last tap at 30c, signaling the trend is holding strong.
Don’t fade this one—it's been consolidating in a similar pattern to CRYPTOCAP:AAVE before its breakout above $160, but this time in a m

BB / USDTI believe Bitcoin has the potential to complete this scenario, and I think it is a good buying opportunity as it has approached its demand zone. What do you think? Please share your opinion with me.

BB sell/short setup (12H)It seems a complex pattern is forming, where wave C could complete within the red zone, leading to a BB drop.
We are looking for sell/short positions in the red zone.
The target could be the green zone.
Closing a daily candle above the invalidation level will invalidate this analysis.
For risk m

See all ideas
Summarizing what the indicators are suggesting.
Oscillators
Neutral
SellBuy
Strong sellStrong buy
Strong sellSellNeutralBuyStrong buy
Oscillators
Neutral
SellBuy
Strong sellStrong buy
Strong sellSellNeutralBuyStrong buy
Summary
Neutral
SellBuy
Strong sellStrong buy
Strong sellSellNeutralBuyStrong buy
Summary
Neutral
SellBuy
Strong sellStrong buy
Strong sellSellNeutralBuyStrong buy
Summary
Neutral
SellBuy
Strong sellStrong buy
Strong sellSellNeutralBuyStrong buy
Moving Averages
Neutral
SellBuy
Strong sellStrong buy
Strong sellSellNeutralBuyStrong buy
Moving Averages
Neutral
SellBuy
Strong sellStrong buy
Strong sellSellNeutralBuyStrong buy
Displays a symbol's price movements over previous years to identify recurring trends.