📊#BCH cup handle structure📈🧠From the perspective of the macro cycle, we still have not achieved our goals. We have been consolidating in the periodic resistance zone for a period of time. Currently, we have constructed a bullish cup-and-handle structure, so there is a high probability that we will use this structure as a supporting force to start rising.
Let's see👀
🤜If you like my analysis, please like 💖and share it💬
💕 Follow me so you don't miss out on any signals and analyze 💯
BCHUSDT.P trade ideas
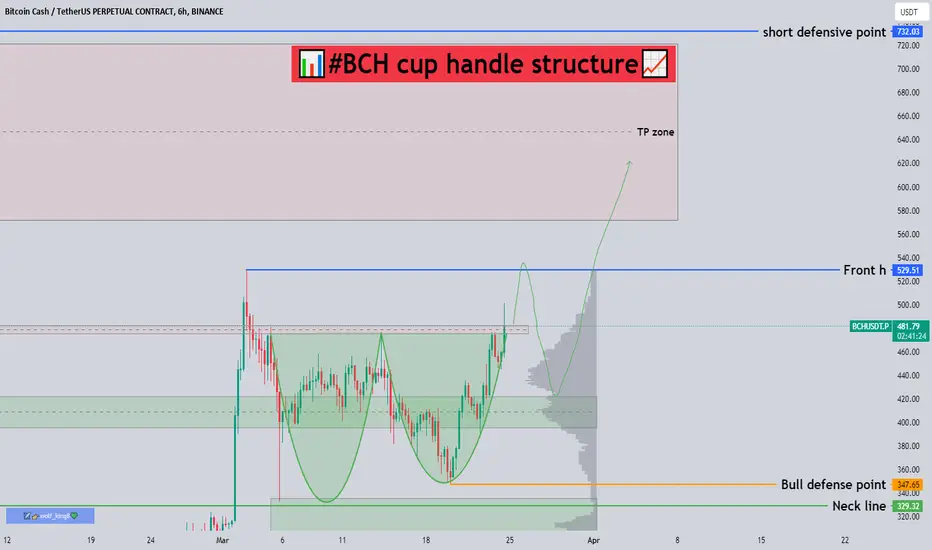
BCHUSDT.PHello Trader BINANCE:BCHUSDT.P
the potential to form a cup and handle area, for the right soulder is still fairly bearish chart. I have determined the entry point. please see the picture
Please add a comment and Positive feedback and constructive criticism are important to authors and the community.
Disclamer: Not Financial Advice

BCHUSDT 1W Where to sell Bitcoin Cash if the growth startsToday, we want to focus your attention on the global and maximum chart of the BCHUSDT trading pair
In August 2017, it was "a very hot summer": the alt season was in full swing, and there was also a BTC fork, as a result of which Bitcoin holders received free BCH 1:1. The same manipulation took place after during the fork of Bitcoin Gold - another sad fork coin.
After the fork, the BCHUSDT price soared to $4200-4400 on various exchanges.
And then the success story of BCH disappeared.
At the time when BTC during 2019-2021 was able to increase in price 20 times, the price of BCH could not even rise to half of the ATH indicator.
On November 15, 2018, the Bitcoin Cash blockchain was split (hard fork) into two branches — BCHABC and BCHSV.
There is also a lot of controversial information surrounding one of the biggest supporters and the organizer of the BCH fork - Roger Ver
In a word, we bypass such projects and do not trade it.
Now, about the chart
The 13th week of red candles and an uncorrected fall in the BCH price continues.
There is not much left to the absolute price minimum, in the area of $75.
We cannot recommend the purchase of this asset. At the moment, there are many different interesting projects for investment
If a miracle happens on the market and the price of BCHUSD does turn upwards , then on the graph we have shown where it would be good to sell off your BCH.
Here, each individual has to look at his deposit where he bought BCH and where it is profitable for him to sell.
Levels from above for sales: $250, $350, $550. The most positive and still weakly realistic forecast for the growth of the Bitcoin Cash price is $900
_______________________________
Since 2016 , we have been analyzing and trading the cryptocurrency market.
We transform our knowledge, trading moods and experience into ideas. Each "like under the idea" boosts the level of our happiness by 0.05%. If we help you to be calmer and richer - help us to be happier :)

Good level for short positionHello
I do not believe in market rise
I marked position on the chart. I think it’s a good level to short. So i entered.
Let’s see what happens


Bitcoin Cash(BCH): Good Point of TurnoverWe caught BCH with a good point of turnover, which seems like a good starter for further movement to lower zones.
We are looking here for the first orange line to be reviewed, from which we have two possible scenarios!
Swallow Team

Inflation Deflator Indicator Signals Sell for $BCHID has printed a 1h sell signal. The price has consolidated around this price and should drop soon to previous demand zone.

#BCH Possible Bearish Scenario #BCH Possible Scenario
Waiting for breakdown of trendline
Waiting for breakdown of support zone
After retest of breakout will be nice Short

BCH/USDT bullish reversal from key support? 👀 🚀BCH analysis💎 Paradisers, brace yourselves for a thrilling trading expedition with #BCHUSDT, currently anchored at a critical support area, signaling a potential shift in market dynamics.
💎 Its breakout from a downward trendline heralds a promising path ahead for #BITCOINCASH, igniting a bullish momentum poised for an upward journey. Should this vigor continue, we anticipate challenging the $535.7 resistance zone as our forthcoming milestone.
💎 Should the momentum of SET:BCH show signs of diminishing, we're set to observe a robust recovery attempt from the crucial support mark at $229. However, slipping past this vital line may denote the start of a more decisive bearish phase, emphasizing the need for vigilance in the evolving market landscape.


#BCHIn time D1, after a three-wave correction and by making a rectangular pattern and exiting the density of the trading range, the next targets indicated in the chart will be available if it stabilizes above $250. Therefore, to continue the upward trend, it must penetrate above $250, otherwise the break will occur from below and will touch the range of $187 to $200.

BCH Oi rise insanly BCH Oi rise insanely
that;'s why coin is pumping
2 way for a reversal
some big sellers GOT liquidated - in that case you will see BIG cangle and Paranormal volume
2nd - structure change
better to watch video to see these 2 scenarios

BCH: Resistance BreakoutTrade setup : Bullish break above $500 resistance signals continuation of uptrend, with +20% potential upside to $600 next. The $500 level was where price got rejected in early March, hence, that’s a key level. Stop Loss (SL) level at $460.
Trend : Uptrend across all time horizons (Short- Medium- and Long-Term).
Momentum is Bullish (MACD Line is above MACD Signal Line and RSI is above 55).
Support and Resistance : Nearest Support Zone is $400, then $300. The nearest Resistance Zone is $500, which it broke, then $600.

BCH 20% of Oi can be trappedBCH 20% of Oi can be trapped
How to trade it?
Fake outs or wait for break out from 1st deviation

BItcoin Cash creating fresh demand on weekly Timeframe Bitcoin Cash is currently creating fresh demand on the weekly timeframe, accompanied by strong imbalances. The first take profit area is expected to be around $1200 USD, but for the long term, the target price is anticipated to reach $4500 USD.


Bchusdt MexC 22H divergence RSI set to 14On a 22 hour there is a divergence on the RSI I see a dump coming Monday, but this is crypto, so it could do anything

Bitcoin Cash Surges in March, Eyes $750 But Faces ResistanceBitcoin Cash (BCH) has been on a tear this month, rallying from $231 in February to currently trading at $542. This impressive surge of over 130% has positioned BCH at a critical juncture.
The current resistance point for BCH sits at $542 . If bulls can muster the strength to push through this barrier, analysts predict a potential surge towards $750 or even $815.
However, a failure to breach the $542 resistance could trigger a pullback, potentially bringing BCH back down to the $400 support level . This scenario would indicate a short-term correction before another attempt to break through the resistance.

BCH: Bullish PennantTrade setup : Bullish breakout from a Bullish Pennant pattern, in the direction of the existing Uptrend. Price could revisit $500 for +10% upside potential or higher. Stop Loss (SL) level at $415.
Pattern : Bullish Pennant - forms typically following a sharp advance, followed by a brief triangular shaped consolidation in price (a small change in direction), before the previous uptrend (bullish) typically resumes. The period of consolidation should have lower volume and the breakouts should occur on higher volume.
Trend : Uptrend across all time horizons (Short- Medium- and Long-Term).
Momentum is Mixed as MACD Line is below MACD Signal Line (Bearish) but RSI > 55 (Bullish). MACD Histogram bars are rising, which suggests that momentum could be nearing another upswing.
Support and Resistance : Nearest Support Zone is $400 (previous resistance), then $300. The nearest Resistance Zone is $500, then $650.

BCH goodYeah it sounds really stupid "Bitcoin cash". But the chart disagrees. Looks like a long reaccumulation. I wouldn't be surprised if it explodes soon. Good to have some. Bullish on all scams.

#BCH/USDT LONG#BCH
We have a strong ascending symmetrical triangle and inside it another ascending triangle that has been positively broken upwards.
Currently the upper boundary of the triangle has been broken.
Expected growth of the pair with correction before completing the ascent
Price Now 248.50
First Goal 278.40
Second Goal 325.90
We have oversold on MACD.
And a strong upward trend

BCHUSDT - Upward ContinuationBCHUSD should continue upwards
It has formed a strange structure with two shoulders on each side and a head. Resembling a inverted H&S pattern.
Great real world application coin.
Bullish

