BIGTIME/USDTKey Level Zone: 0.07500 - 0.07690
HMT v8.1 detected. The setup looks promising, supported by a previous upward/downward trend with increasing volume and momentum, presenting an excellent reward-to-risk opportunity.
HMT (High Momentum Trending):
HMT is based on trend, momentum, volume, and market s

$BIGTIME LONG TRADE
**🎯 Entry:** 0.1625 – Entering at a strategic level for potential upside.
**📈 Targets:** 0.1694, 0.181, 0.1937 – Key levels to watch for profit-taking.
**🛑 Stop Loss:** 0.1568 – Manage risk by sticking to this stop to limit downside.
💡 *Always manage your risk and adjust your position size ac

BIGTIME/USDT Analysis – 30-Minute Chart (OKX)BIGTIME/USDT Analysis – 30-Minute Chart (OKX)
Key Support Levels:
Immediate support: 0.06043 USDT
Stronger support: 0.05960 – 0.05515 USDT (Potential entry zone)
Stop-loss (SL): Below 0.04916 USDT (-12.19% risk)
Key Resistance Levels:
First resistance: 0.06485 USDT (Take Profit 1)
Next resistanc
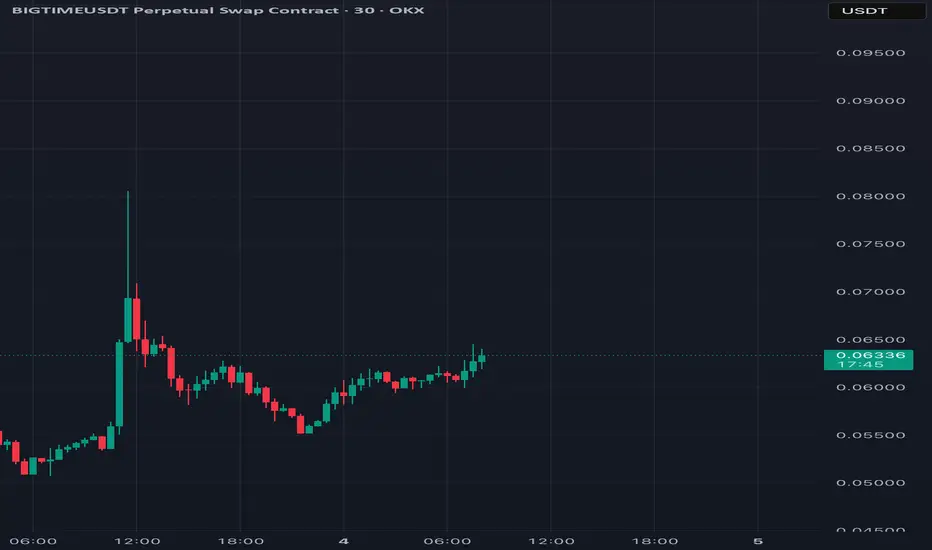
Maybe $0.11!A strong rejection from $0.074 and a re-test of $0.060! If it could pump toward $0.074 once more and break it with a strong bullish candle, $0.109 will be reachable. Since it is fluctuating almost on the price that was launched at most exchanges, it's unlikely to be deeply corrected from here.

BIGTIMELiquidity entered the currency and it was maintaining the price in the past days, meaning it was oversold.

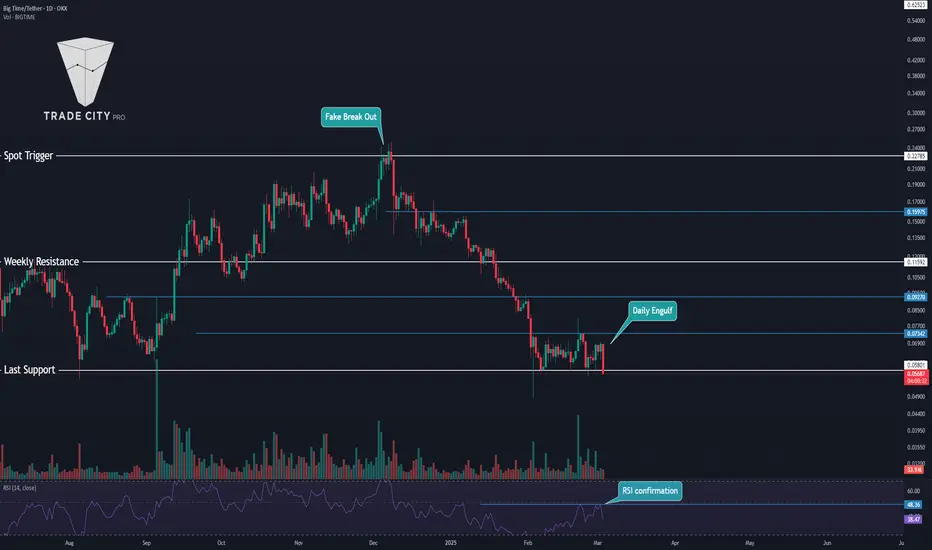
TradeCityPro | BIGTIMEUSDT Final Downtrend?👋 Welcome to TradeCityPro Channel!
Let's analyze and review the new gaming coin BIGTIME and see what the market is going to be like. I feel like we're going to see the final downtrend.
🌐 Bitcoin Overview
Before starting today's altcoin analysis, let's look at Bitcoin on the 1-hour timeframe. S
Big Time (BYBIT-BIGTIMEUSDT.P): A Hidden Giant Poised for ActionThe Market's Crossroads: Ready for the Next Big Wave?
Imagine holding an asset that’s down over 90% from its historical highs yet brimming with subtle signs of revival. Big Time (BYBIT-BIGTIMEUSDT.P) is trading at $0.09929, a far cry from its $0.9995 peak, but its deviation creates a golden window

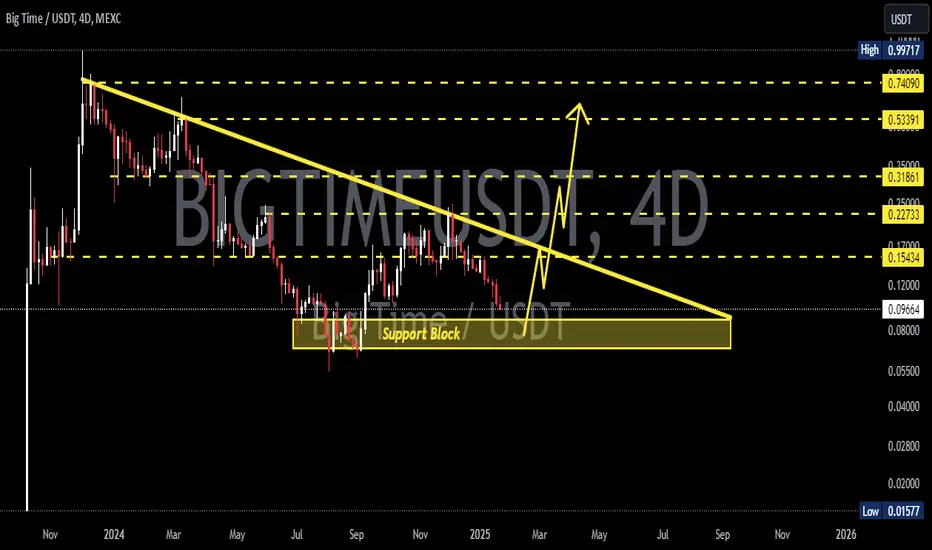
BIGTIMEUSDT 4DBIGTIME ~ 4D
#BIGTIME If you still have Conviction on this coin, buy it gradually from here with a minimum target of 20%++
Bigtime breakout still eminent! I like the reaction I am seeing on the downtrends if u follow closely you see we broke out to 17cents then back test and still showing strength where I expected. Let’s go …below 10ce t invalidated

Bigitime macro move in play Bigtime has broken several trends on the weekly and has been consolidating at a critical support. Now breaking out these are my targets

See all ideas
Summarizing what the indicators are suggesting.
Oscillators
Neutral
SellBuy
Strong sellStrong buy
Strong sellSellNeutralBuyStrong buy
Oscillators
Neutral
SellBuy
Strong sellStrong buy
Strong sellSellNeutralBuyStrong buy
Summary
Neutral
SellBuy
Strong sellStrong buy
Strong sellSellNeutralBuyStrong buy
Summary
Neutral
SellBuy
Strong sellStrong buy
Strong sellSellNeutralBuyStrong buy
Summary
Neutral
SellBuy
Strong sellStrong buy
Strong sellSellNeutralBuyStrong buy
Moving Averages
Neutral
SellBuy
Strong sellStrong buy
Strong sellSellNeutralBuyStrong buy
Moving Averages
Neutral
SellBuy
Strong sellStrong buy
Strong sellSellNeutralBuyStrong buy
Displays a symbol's price movements over previous years to identify recurring trends.