Turkish stock market USD termsTurkish stock market in USD terms. On the point of brake down of the gigantic decending triangle.
XU100 trade ideas

Target 1655Following weekly candles.
I think we're in the end. Time to start short
TP 1655, there is a nice gap to fill there.

Correlation between USDTRY and BIST indexAs we can see, there is a correlation between USDTRY and BIST index. The increase in the stock market index has been influenced by the increase in the price of the USD in Turkey.
But be wary of this rapid increase. A similar experience happened in Iran in the last two years. After the rapid rise of the dollar price in 2019, the stock market index grew rapidly and reached about two million one hundred thousand units. During this increase, many people joined the stock market, and a lot of money flowed into the stock market. But a large part of this index increase was a bubble. In mid-2020, the Iranian stock market began to fall sharply and fell to about one million and one hundred thousand units. In the meantime, many people lost their money. And after that, the Iranian stock market plunged into a period of recession that continues to this day.

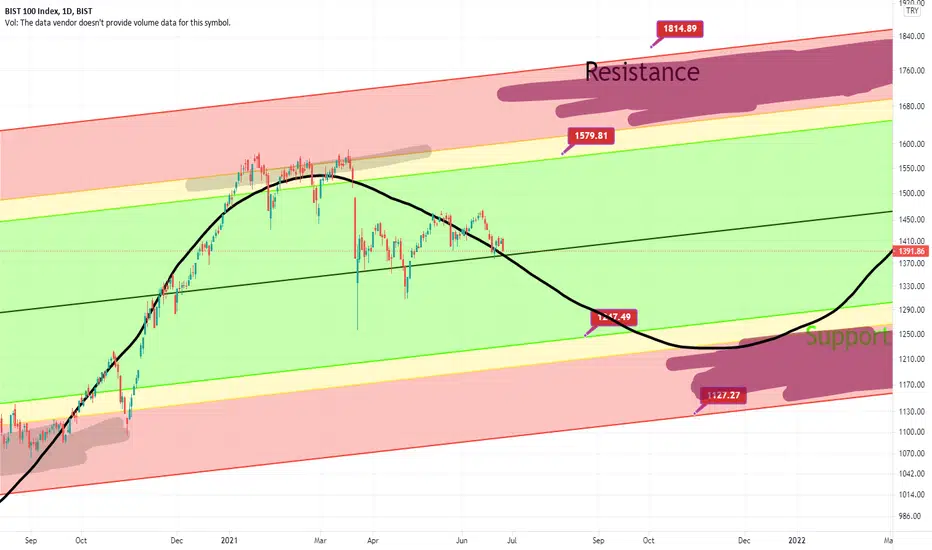
Target 1830Following monthy chart.
Bist Long term flag target is 1830.
There is still 11 days for this month to completed. We can hit this month or next week.
The main concern is, after hitting target, we can move to gap in 1190.
Let's wait and see.

XU100 İÇİN KENDİME NOTYTD kendime not amaçlı karalamamdır. iki çanaktan birini tamamlamasını bekliyorum. buradan düşüş olursa küçük çanak tamamlanmış kulpa başlamış olacak, kulp düşüşü gelecek. ya da doğrudan turuncu büyük çanağı tamamlamaya yönelerek direkt hızlı yükseliş gelecek diye bireysel beklentim var. yatırım tavsiyesi değildir.

We need, hope and expect a retracement We need, hope and expect a retracement , there s a huge gap down, negative divergence for rsi and macd. . Good luck.. There will be blood. However, note that fomo may beat the technical indicators
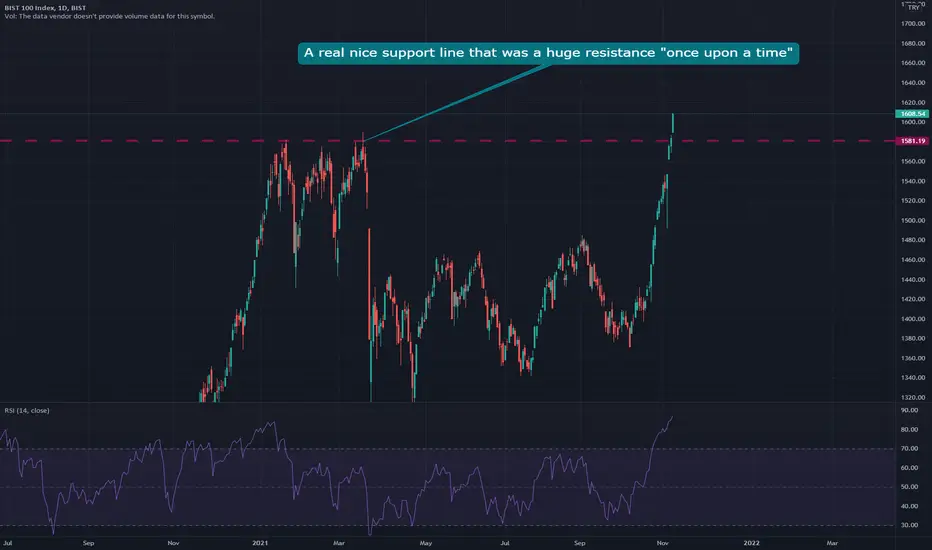
Once upon a time there was a huge resistance point Once upon a time there was a huge resistance point that made xu100 fell l'ke a piece of sh...
XU100Fibo show us that XU100 is up to 1816 barrier. As USDTRY are in record high, XU100 shares are so cheap anyway.

No Retreat No Surrender, Not Yet. BEARISH CRABNo Retreat No Surrender, Not Yet. BEARISH CRAB "close to perfection"


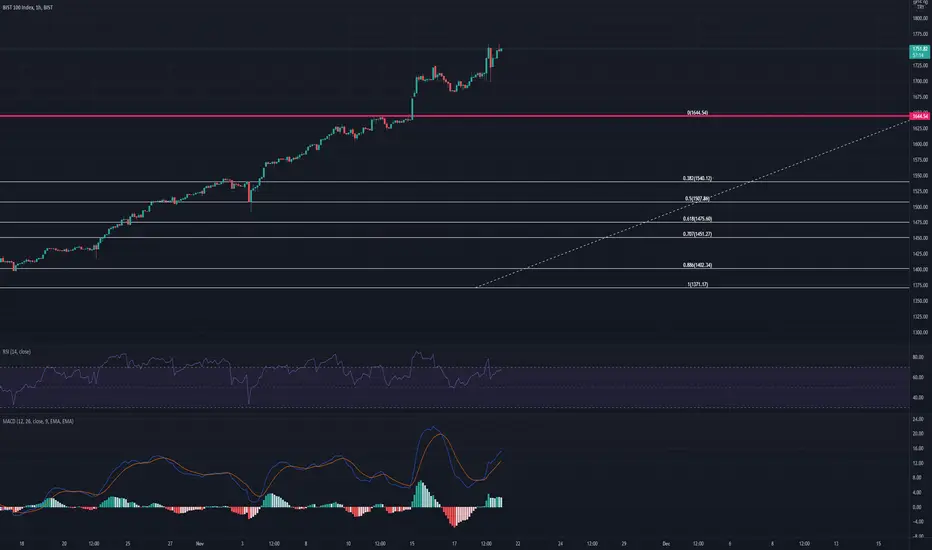
Target 1460 - RSI Divergence and Fibo + trend resistancewatch it with tight stop (1380s) but it'll probably go up from here (if it wont stay under 1387) and first target is 1460
(this analysis will self destruct when central bank of Turkey wage war on the market :) )

Lower low, bearish market structureXU100 Market Structure has been bearish with a lower low. Looking for a higher high for short pozition

BORSA ISTANBUL RESISTANCESBu çalışma dolar bazında borsa istanbul'daki potansiyel direnç seviyelerini takip etmek için paylaşılmıştır.
Temel olarak borsa istanbul'daki taban oluşumunun tamamlanıp, yukarı yönlü trend'in başladığından emin olmak için bu seviyelerin takibi önemli olabilir.

100k area is expected%50 retracement for next 8 months ???
little place for long with global stock indexes.
Then big dump with global eqities !!
only study..


XU100/USDTRY. BIST100 USD parity Wyckoff Accumulation PatternBist100 USD parity chart is in a sideways and range bound period since mid March 2021. Closely watching if this pattern continues after this SPRING movement or just flashes deeper.
Lets see..


XU100 DO or DIEWelcome to my XU100 analysis.
1) Neutral First of all when we draw a regression trend from the Corona crisis (March 2020) to the Triple Top of 1580 level, apparently we are still in a bull run. However, the price level dropped below the regression trend on 21st of April but it went back into the regression trend. Currently the support of the trend is at 1432 level, and today's close price is clearly below that level. This is an extremely bad sign. However, The price could jump back into the channel just like it happened before. So according to this analysis, the price should immediately get inside to the channel.
2) Bullish From the bullish perspective, Orange trendline is clearly the support of the current bull run. Above the orange line, we still expect further growth of the price. Support level of the Orange Trend line is 1386. Bulls should defend 1386 with all their power, otherwise the scenario turns about to be bearish.
3) Bearish From the bearish perspective, regression trend is now broken, and if orange line doesn't hold, or bulls couldn't defend, then initial price target is around 1284 where I draw with green line. Green line worked 2 times as resistance and 1 time as a support.
If bulls can defend the 1432-1386 zone, then we may see another jump to the red resistance line, which is around 1480. If able to break above, then investors should directly aim for 1900.
Overall, between 1432 and 1386, it is a "now or never" time for XU100. Below this level, it is extremely bearish, above it it is a sign of the continuation of the bull run.
This is not a financial advice.
