$DJI & $NDX at MAJOR RESISTANCEDaily
The TVC:DJI has done well since April & we noticed a sentiment change. This is why we turned bullish. Only problem? Lack of volume. We can see that volume stayed under the pink dots. This is an average of 90 days.
We can also see this by the Money Flow. As of now the lowest peak since mid March on this indicator.
---
Weekly
The TVC:DJI RSI hasn't broken the halfway point. This is needed for more bullish momentum.
Money flow is slanting lower. The interesting tid bit is that volume for the week is not bad at all. But compare this to Jan 2024 and 4th quarter of the same year... LOWER.
Posted this yesterday, see profile for more info.
US30 trade ideas

Are we staging a recover today ? Looks like the big boys are eager to buy at this level. Lets wait and see if we get a second chance to get in.
DOW/US 30 - ENTER SLOWLYTeam, with the DOW/US30,
We been waiting for the last two day
as we expect market will drop before RATE announcement
this is a good entry but buy slowly
if it drop to second box, double up.. the volume
Trade with confident.

KEEP LONG ENTRIES FOR NEXT TOP AT 46500We will move our pivot point up from previous pivot, target price is 46500, timezone is marked between 2nd to 23rd December 2024 to align with the top. Price and time are growing out in well structured Phi models and we expect that if 46500 price is reached within the marked timezone then a strong market correction will follow.
Although our actual projection for the major market top still remains at 27th October 2025 we expect that markets will begin to stall if price reaches the 46500 price level earlier.
Trade safe

DowJones INTRADAY falling resistance at 41420Key Support and Resistance Levels
Resistance Level 1: 41420
Resistance Level 2: 41900
Resistance Level 3: 42470
Support Level 1: 40240
Support Level 2: 39760
Support Level 3: 39150
This communication is for informational purposes only and should not be viewed as any form of recommendation as to a particular course of action or as investment advice. It is not intended as an offer or solicitation for the purchase or sale of any financial instrument or as an official confirmation of any transaction. Opinions, estimates and assumptions expressed herein are made as of the date of this communication and are subject to change without notice. This communication has been prepared based upon information, including market prices, data and other information, believed to be reliable; however, Trade Nation does not warrant its completeness or accuracy. All market prices and market data contained in or attached to this communication are indicative and subject to change without notice.

Dow Jones Index (US 30) – Further Recovery Potential?The Dow Jones Index (US 30) has moved steadily higher over the last 10 trading days as traders continue to unwind short positioning attached to the popular sell US assets idea that seemed to dominate at the beginning of April, in the pre President Trump 90 day tariff pause era.
At the start of this new week, after a period of quiet trading on Monday, mainly due to the UK bank holiday, the focus for traders across the next 4 days may well be on whether President Trump and his negotiating team can report progress on trade deals with allies, as well as the Federal Reserve Interest Rate Decision (Wednesday 1900 BST) and Press conference, led by Chairman Powell (commencing 1930 BST).
Now, while no change to US interest rates is expected at this meeting, the update from policymakers regarding their current outlook for the economy, inflation and path of interest rates across the rest of the year, could well generate some market moving headlines that may impact whether the US 30 continues to post fresh highs, or gives up some of its recent gains.
Technical Update: Further Recovery Potential?
The recent sharp sell-off that saw the Dow Jones Index fall more than 19% eventually found support around 36873, which was a level that was equal to the 50% Fibonacci retracement of the October 2022 to December 2024 strength.
This type of decline back to such a retracement can sometimes see a reactive recovery materialise from the downside extremes in price, and as the weekly chart below shows, 36873 seems to have helped prompt the recent upside move.
Interestingly, the reactive recovery in the index has now seen closing breaks above 40783, a level that is equal to the 50% Fibonacci retracement of December 2024 to April 2025 price weakness, and traders may now be viewing this move as suggesting further possibilities for a more extended phase of price strength.
Assessing the Daily Chart
While the weekly chart levels are useful, it can also be helpful to assess the daily chart to try to gauge which levels, if broken, may suggest earlier clues for the next possible directional move in the Dow Jones Index, in the run up to, during and after the Federal Reserve Interest Rate Meeting and Press Conference.
Possible Resistance Levels:
With recent price strength breaking above resistance at 40783 (50% retracement of the latest decline) this may lead to a more sustained period of price strength.
As such, this may result in further attempts to push higher towards 41809, which is the 61.8% retracement, possibly even towards 42834, which is the March 26th session high.
Possible Support Levels:
The recent strong rally from the weekly support at 36873 (50% retracement of the October 2022 to December 2024 advance), possibly points to this as a long term support.
However, is there anything within the daily chart that may offer clues to shorter term support levels?
By calculating Fibonacci retracements of the April/May 2025 price strength, we can see the 38.2% level stands at 39991.
If closing breaks under this potential support were to occur, then risks might turn towards a more extended phase of price weakness towards 39570, the 50% retracement support level, even 39150, which is equal to the deeper 62% retracement.
The material provided here has not been prepared in accordance with legal requirements designed to promote the independence of investment research and as such is considered to be a marketing communication. Whilst it is not subject to any prohibition on dealing ahead of the dissemination of investment research, we will not seek to take any advantage before providing it to our clients.
Pepperstone doesn’t represent that the material provided here is accurate, current or complete, and therefore shouldn’t be relied upon as such. The information, whether from a third party or not, isn’t to be considered as a recommendation; or an offer to buy or sell; or the solicitation of an offer to buy or sell any security, financial product or instrument; or to participate in any particular trading strategy. It does not take into account readers’ financial situation or investment objectives. We advise any readers of this content to seek their own advice. Without the approval of Pepperstone, reproduction or redistribution of this information isn’t permitted.

US30 (Dow Jones) – Trade Update | May 6, 2025As shared earlier today, price tapped perfectly into the demand zone around 40,920, and we're now seeing the bounce unfold.
✅ I’m currently looking to go long, targeting the 15-min FVG zone (around 41,160–41,240) — as per this morning’s projection.
🎯 Trade idea remains the same:
Valid bullish structure forming
Patience for price to push into the key supply/FVG zone
Will reassess for shorts once that level is reached
⚠️ As always: This is my personal prediction, not financial advice. Please do your own analysis, especially on a volatile NFP day like today. Protect your capital first.
#US30 #DowJones #LongSetup #FVGTarget #SmartMoney #PriceAction #TradingUpdate #VERUMAcademy

US30 (Dow Jones) – Bounce + Rejection Setup – May 6, 2025🔍 Setup Summary:
Price followed my Tuesday prediction precisely, breaking down from the mid-range and now tapping into a demand zone. From here, I expect a bounce into the descending channel, targeting the 15-min FVG and supply zone around 41,160–41,220, before a potential rejection for a deeper move down.
📉 Trade Idea:
Waiting for confirmation of bullish intent from the current demand zone (~40,960–41,000), with a potential retracement into the FVG zone. I’ll then be watching closely for bearish price action to re-enter short in line with overall structure.
✅ Confluences:
Demand zone reaction expected
15-min Fair Value Gap + trendline + supply confluence
Downward channel still in play
Previous prediction unfolding as expected
📌 Bias: Short-term bullish bounce, then bearish continuation
🕒 Timeframe: 15-minute chart
🎯 Watch Levels:
Entry long: ~40,960–41,000 (confirmation needed)
TP1 (for longs): 41,160
Re-entry short zone: 41,160–41,220
Extended bearish targets: below 41,000
⚠️ Disclaimer:
This idea reflects my personal analysis and bias. It is not financial advice. Always do your own research, apply risk management, and trade only when you have clear confirmation. Protect your capital first.

US30 Stalling Under Resistance – 06/05/2025📉 US30 Stalling Under Resistance – 06/05/2025 📉
🔥 Relief Rally Slowing Down?
After bouncing clean from the 36,700s, US30 has been grinding higher and just tapped into 41,200–41,300 — the same resistance zone that’s been rejecting price since early April. Now, the 1H EMAs are starting to curl, and we’re seeing signs of hesitation 🧊.
Momentum is fading just under key resistance. Bulls still have control above 40,700, but if that level goes… lights out 💡
🔍 Key Technicals:
🔹 Resistance Zone = 41,200–41,300 (retested multiple times)
🔹 Support = 40,700, key structure from April
🔹 Final upside target = 42,359 if we break
🔹 EMAs (blue/white) starting to compress → volatility loading ⚡
🎯 Trade Scenarios:
🟰 Current Range = 40,700 – 41,300
🚀 Break + close above 41,300 = clean runway toward 42,359
🔻 If price loses 40,700 = short setups down to 39,775 then 39,200
Bonus 🎁: If we flush fast, look for liquidity grabs below 39,775 to snipe scalp longs 🥷
🧠 Mindset Notes:
✅ No breakout? No trade. Let the chart prove it.
❌ Don’t short blindly into strength — let levels confirm!
💎 Remember: "slow grinds up often lead to sharp dumps down"

US30/DJI "Dow Jones" Index CFD Market Heist Plan (Day or Swing)🌟Hi! Hola! Ola! Bonjour! Hallo! Marhaba!🌟
Dear Money Makers & Robbers, 🤑💰✈️
Based on 🔥Thief Trading style technical and fundamental analysis🔥, here is our master plan to heist the US30/DJI "Dow Jones" Index CFD Market. Please adhere to the strategy I've outlined in the chart, which emphasizes short entry. Our aim is the high-risk Yellow MA Zone. Risky level, oversold market, consolidation, trend reversal, trap at the level where traders and bullish robbers are stronger. 🏆💸"Take profit and treat yourself, traders. You deserve it!💪🏆🎉
Entry 📈 : "The vault is wide open! Swipe the Bearish loot at any price - the heist is on!
however I advise to Place sell limit orders within a 15 or 30 minute timeframe most nearest or swing, low or high level for Pullback Entries.
Stop Loss 🛑:
📌Thief SL placed at the nearest/swing High or Low level Using the 1D timeframe (41000) Day/Swing trade basis.
📌SL is based on your risk of the trade, lot size and how many multiple orders you have to take.
Target 🎯: 35000 (or) Escape Before the Target
💰💵💸US30/DJI "Dow Jones" Index CFD Market Heist Plan (Swing/Day Trade) is currently experiencing a Bearish trend.., driven by several key factors.👇👇👇
📰🗞️Get & Read the Fundamental, Macro, COT Report, Geopolitical and News Analysis, Sentimental Outlook, Intermarket Analysis, Index-Specific Analysis, Future trend targets with Overall outlook score... go ahead to check 👉👉👉🔗🔗
⚠️Trading Alert : News Releases and Position Management 📰 🗞️ 🚫🚏
As a reminder, news releases can have a significant impact on market prices and volatility. To minimize potential losses and protect your running positions,
we recommend the following:
Avoid taking new trades during news releases
Use trailing stop-loss orders to protect your running positions and lock in profits
💖Supporting our robbery plan 💥Hit the Boost Button💥 will enable us to effortlessly make and steal money 💰💵. Boost the strength of our robbery team. Every day in this market make money with ease by using the Thief Trading Style.🏆💪🤝❤️🎉🚀
I'll see you soon with another heist plan, so stay tuned 🤑🐱👤🤗🤩

US30: Local Bearish Bias! Short!
My dear friends,
Today we will analyse US30 together☺️
The market is at an inflection zone and price has now reached an area around 41,170 where previous reversals or breakouts have occurred. And a price reaction that we are seeing on multiple timeframes here could signal the next move down so we can enter on confirmation, and target the next key level of 41,039..Stop-loss is recommended beyond the inflection zone.
❤️Sending you lots of Love and Hugs❤️

US30 - LONGAnother retest of the key level before buyers potentially take over again and make higher highs.

Dow Jones Correction in May 2025: Key DriversDow Jones Correction in May 2025: Key Drivers
Summary: The Dow Jones Industrial Average (DIA) is under pressure and likely headed for a correction due to the Federal Reserve’s tight monetary policy, trade uncertainty from Trump’s tariffs, and weak economic data.
Key Drivers:
➖ Federal Reserve Policy: At the May 6–7 meeting, the Fed is expected to maintain the 4.25–4.5% interest rate due to persistent inflation (2.7% forecast for 2025) and a robust labor market (+177K jobs in April). This dampens hopes for rate cuts, pressuring stocks.
➖ Trump’s Tariffs: New tariffs raise inflation risks and recession fears, reducing the appeal of Dow Jones constituents like Caterpillar and Walmart.
➖ Weak GDP and Global Volatility: A 0.3% GDP contraction in Q1 2025 and declines in Asian markets (1.6–1.8%) signal global instability.
➖ Technical Indicators: DIA trades below its 200-day moving average (~420 USD), with fewer stocks above this level (down from 76% to 55% since January), indicating market weakness.
➖ Outlook: Analysts (Long Forecast) predict volatility, with a potential drop to 38,958 in May, despite an average forecast of 43,370 by month-end. Historically, corrections occur every 1.88 years, and current conditions (tariffs, inflation, GDP) heighten the likelihood of a 10–15% decline.
Target: My downside target for the Dow Jones is 38,555.00.
Current factors and historical trends strongly suggest a near-term correction.
Idea for S&P 500:

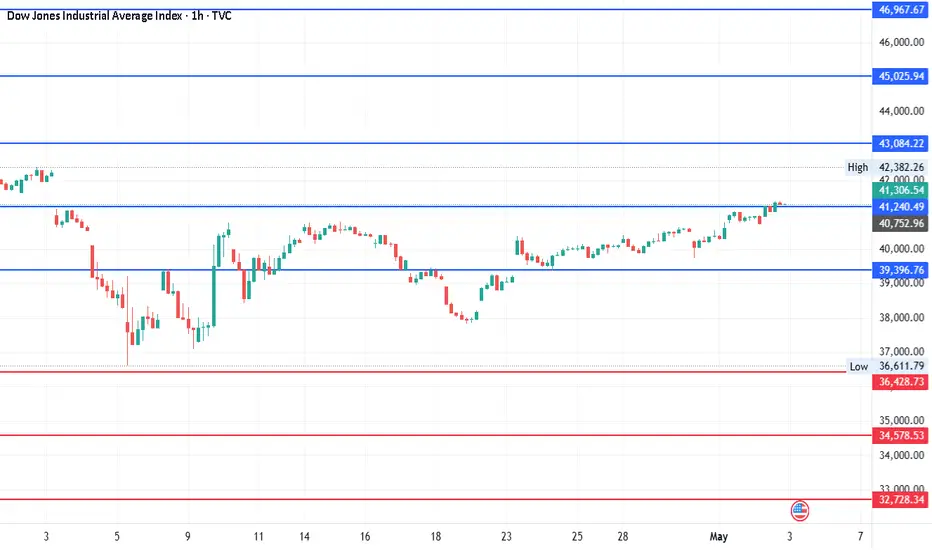
DJI - 2000 pts already moved out of 8000 pts since last posted?It has already moved around 2000 points since last posted on 22nd April. Expecting around 8000 points moved as per mentioned earlier and the levels are still the same. Introduced additional levels for the better understanding. So, another 6000 points move pending before any reasonable correction? let's see.
Upside: 41240.49, 43084.22, 45025.94 and 46967.67
Downside: 34578.53, 32728.34, 30786.61 and 28844.88
US30 Long Setup | Targeting the Unfilled 4H Gap🧠 Technical Analysis
🔹 Unfilled Gap (Target Area)
A large 4H imbalance/gap remains unfilled between 41,500–41,600, highlighted in yellow.
This acts as a magnet for price — the market often retraces to fill inefficiencies after structure is built below.
🔹 Breakout and Retest
Price has broken above a consolidation structure and returned to retest the breakout level.
The "Invalidation Zone" (~41,147–41,222) is clearly marked — if price breaks below this area, the long idea is invalidated.
Current candle shows strong bullish follow-through after testing the invalidation area.
🔹 Bullish Market Structure
The overall price action is forming higher highs and higher lows.
The recent impulse move confirms bullish momentum and continuation potential.
🛠 Trade Setup
Bias: Bullish
Entry: ~41,237.50 (current price)
Stop Loss: Below 41,147 (clear invalidation zone)
Target: 41,541.52 (unfilled 4H gap)
Risk:Reward: High (approx. 1:3+)
✅ Why This Trade Makes Sense
Clean structure breakout
Clear imbalance target above
Strong follow-through candle at breakout retest
Logical invalidation level below the range
⚠️ Risk Considerations
Watch for volatility around news events (US data, FOMC, etc.)
A close below the invalidation zone would signal failed breakout
🧭 Trading Plan
If price continues to hold above 41,200 and prints bullish continuation patterns (e.g., bull flags or strong engulfing candles), holding toward the 41,540–41,600 range remains valid.

US30 (Dow Jones) Daily Analysis — Make or Break at DowntrendUS30 Daily Analysis
Technical Outlook — May 1, 2025
🔍 Current Market Condition:
US30 is trading near a critical confluence zone where price meets descending trendline resistance and horizontal supply. This level previously acted as a strong rejection point, making the current test significant.
🧩 Key Technical Highlights:
Price testing descending trendline from March highs.
Horizontal resistance zone around 41,000–41,300 is being challenged.
Stochastic oscillator is nearing overbought levels, suggesting caution.
The ascending channel’s lower boundary recently held as support near 38,000.
Compression forming between trendline resistance and rising support.
📈 Possible Scenarios:
Bullish Case:
Break and close above 41,300 could open path to retest 43,000 and 45,000 levels.
Look for a bullish daily candle with strong volume above trendline.
Bearish Case:
Rejection from current resistance could send price back toward 39,500–38,000 support zone.
Watch for bearish divergence on Stochastic or failed break above resistance.
📌 Important Note:
This week's economic calendar includes key data releases—stay alert for volatility that may trigger a breakout or reversal.
If you found this analysis valuable, kindly consider boosting and following for more updates.
Disclaimer: This content is intended for educational purposes only and does not constitute financial advice.

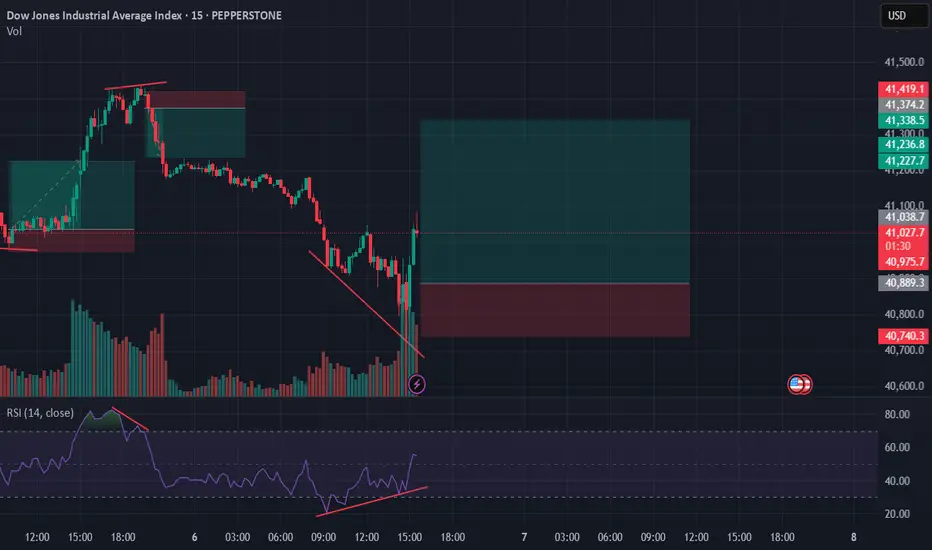
US30 BUYwe are currently in a US30 long, we are using the 15min ORB clean break and retest of the range we have also retested the previous day high, put stops at the low of the range, we target 1-1.5 RRR lets see how it goes

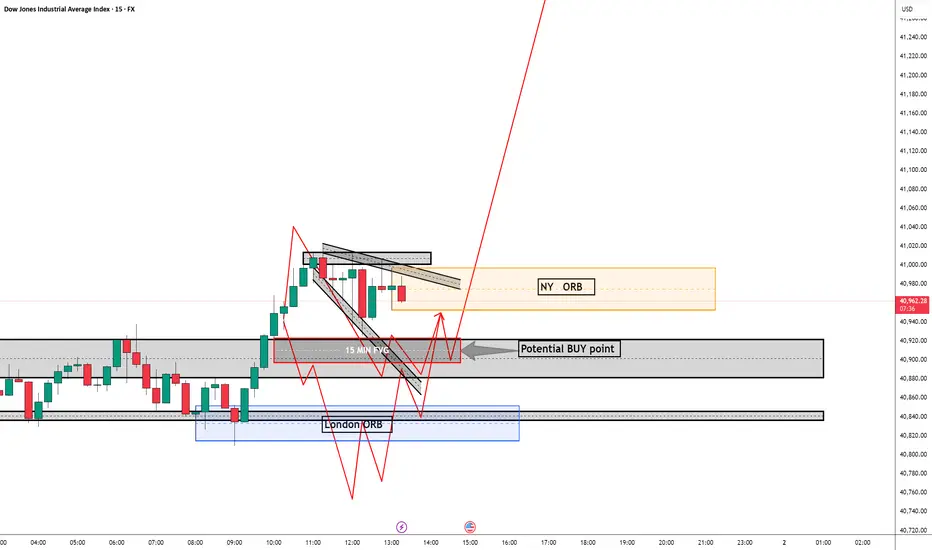
Potential Entry Point on US30 ?The NY session Just opened. looks like the price is consolidating at the moment.
Waiting for low liquidity to be raid and price reaching the 15 min FVG before entering a Long position
what are your thoughts ???
US30: Local Bullish Bias! Long!
My dear friends,
Today we will analyse GOLD together☺️
The recent price action suggests a shift in mid-term momentum. A break above the current local range around 40,968.4 will confirm the new direction upwards with the target being the next key level of 41,302.5 and a reconvened placement of a stop-loss beyond the range.
❤️Sending you lots of Love and Hugs❤️

US30 (Dow Jones) Outlook – Thursday SetupWe're seeing a strong bullish push following the London Open. My expectation is for price to dip back into the London ORB zone and test one of the marked short-term demand blocks.
🔁 Play-by-Play Expectation:
Pullback to the lower OB zones and ORB.
Strong reaction from demand with bullish continuation.
Final target: top of the H1-H4 Supply Channel above 41,200–41,300 zone.
🧠 Contextual Notes:
Clean structure break post-London open.
Price filled imbalances efficiently.
Still respecting bullish internal order flow.
Clear confluence with trendline + FVG zones below.
📍 Key Zones:
Demand/Entry: ~40,840–40,760
Target Supply: ~41,250+
Invalid below: 40,643
Let the market come to your zone — no chasing. Be patient and precise. 🧘♂️
⚠️ DISCLAIMER:
This is my own analysis and I’m still learning. Please do your own research and be careful with your risk management. This is not financial advice.

US30 Bulls Testing Resistance – Will 40,770 Hold or Break?Price is currently testing the 40,770 🔼 resistance zone after a strong bullish push. This level has previously acted as a key ceiling and could determine the next directional move. Price has been climbing steadily with higher lows, indicating bullish momentum.
Support at: 40,194 🔽, 39,070 🔽, 36,800 🔽
Resistance at: 40,770 🔼, 41,552 🔼, 42,540 🔼
Bias:
🔼 Bullish: A clean breakout and hold above 40,770 could open the path to 41,552 and 42,540.
🔽 Bearish: Rejection at 40,770 or a drop below 40,194 could signal weakness and send price back to 39,070.
📛 Disclaimer: This is not financial advice. Trade at your own risk.

Dow Jones Bullish Setup A potential bullish setup is forming on the Dow Jones Industrial,
suggesting a long opportunity upon confirmation. The trade will only activate if key validation criteria are met, targeting a 1:3 risk-reward ratio.

Indices tradersLondon session is manipulative protect your position with a stop-loss above entry cause when the New York session come it can come back to your entry point and still go to your direction so use a good risk management to be safe . Remember this is an idea so analyze and compare
