Bitcoin Bearish Fractal Jun 2014The most unwanted outcome for Bitcoin's price action in the next few weeks would be similar to what happened in June 2014. The price managed to get back above the 200-day SMA twice, but eventually fell below it again, starting a bear market in 2014. I’ll be closely monitoring the 200-day SMA line in the coming weeks. Bitcoin should not close below it again!
BLX trade ideas

Bitcoin Bearish Fractal Dec 2019The current 6-month consolidation of Bitcoin's chart looks similar to the one in December 2019. The price closed above the 200-day SMA twice, then fell back below it. Bitcoin should not close below the 200-day SMA again in the next few weeks to invalidate this fractal. If it does, then I will be very bearish.

Bitcoin Bullish Fractal Oct 2023The current 6-month consolidation of Bitcoin's price action looks similar to the one in October 2023. The price has now broken out above the 200-day SMA. If it continues to hold above and move up in the next few weeks, the bull market will continue.

We haven't seen BTC ATH yetIf you don't count in fiat currency, we haven't seen the 2021 high exceeded yet (In relation to the stock market)
📝The current picture in Technical analysis, against the positive fundamentals, will ruin the traders who will soon start shorting Bitcoin. But that's normal, their liquidations are fuel for further growth.
📝Everything is going according to plan, and by the end of this year, we will see a real ATH, as I said before in the quoted posts.
💡Also, the RSI clearly shows that we will have a 3-wave cycle according to my 3-wave model, which I discussed before.

Bitcoin - Are we tracking towards new lows?After the last video, thought I'd do a little follow up since its on track atm. Outlining levels Im looking at and checking into ETH and some quick alts

Bitcoin Bullish Fractal May 2016The most bullish scenario for Bitcoin can be compared to the price action in May 2016. After completing its 5-month correction, the price returned to retest the ATH a few times, forming a VCP (Volatility Contraction Pattern), and then shot up in the following days. Let’s see how strong it will be.

Bitcoin Bullish Scenario Nov 2016Since Bitcoin has been showing strength in the last few weeks, let's look at a possible scenario similar to the price action in November 2016. This suggests that Bitcoin's volatility will slow down and the price will gradually rise in the next few weeks. However, if Bitcoin falls back below the 200-day SMA, this idea will be invalidated.

BTC, Let's keep it simple shall weAh, the crypto jungle, where even the bears like to dance! 🕺 So, here we are, staring at a mature bear flag on the daily chart like it's that ex you thought you were over, but they just keep showing up. And if this bad boy breaks down decisively, we're careening straight into the “Oh No Zone” with a potential target between 45k and 48.8k.
And what's this? A Death Cross? Sounds like a rejected name for a 90s metal band, but here it is, grimly reminding us that sentiment is shifting faster than a squirrel on a sugar rush. 🐿️
Now, while retail investors are nowhere to be seen (probably hiding under their beds), the whales are out there doing what they do best—hoarding like it’s Black Friday at a crypto sale. 🐳 And of course, rate cuts are looming like your landlord when rent's due, which in crypto-speak means bearish first, bullish later. It's like being told your rollercoaster ride is delayed but, hey, there's a free ice cream at the end! 🎢🍦
Meanwhile, Gold is out there flexing at an all-time high, giving Bitcoin the cold shoulder like it's a high school crush that just found a new date to the prom. And Bitcoin dominance? Still strutting its stuff, leaving altcoins to suffer in silence.
Over in the ETH/BTC corner, things are looking as bearish as my last attempt at a diet—good intentions, but no follow-through.
Good News? Who Cares!: Good news hits the market and... nothing happens. At this point, it’s like shouting into the void: “BTC ETF occurred! ETH ETF occurred! Halving occurred!” And the market’s like, “Meh.”
🇺🇸 All eyes are on the US Presidency coming up in 2 months. Until then, it's like waiting for your blind date to arrive—highly uncertain and probably not going to end well.
Yet, here I am, my degenerate self, telling you this might just be the perfect recipe for a great bull market! 🍲
But let's be real—experience tell me that caution is advised.
That's it, that's the idea - Good night

Bitcoin Top indicator - Pitchfork ideaWatch out for the next touch of the Medium Line of the Pitchfork (Schiff Modified). This might be the top of the current Bitcoin cycle.
If we break the Medium Line, the upper lines might get relevant for spotting the top.
Credit to Crypto Cobra on YouTube.

Diminished cycles In each cycle we grow less and less, I wonder how it will look like now.
Will the 4 year cycles turn into a longer cycle in some time?
I assume that probably yes.

BTC new cycleBuy at the zone when the MACD histogram is near the 0 line - this means the downtrend is weakening, which is a good timing.

Bitcoin: Bullish on All TimeframesThis is Sunday evening and it is time for a Bitcoin TA. I will go accross multiple timeframes starting from 1W down to the 2H.
On the monthly timeframe, we can look back to 2020. As of 2021, we experienced this year a 7 months in a row uptrend until March, after which holders have been struggling since.
However, this cycle looks different, because price has been holding and accumulating in the upper area (78%) of the fibonnaci retracements.
This month will close soon, and price should close above the exponential moving averages and print a long lower shadow candle pattern, if things continue like this.
The volume profile is in sync with the fibonacci retracements, indicating key support levels at 58 800, 47 000, 38 800.
On the weekly timeframe, a gigantic cup and handle is forming.
The key resistance to break is at 70 000, and the pattern target would be 126 000.
Moving averages remain bullish and the 50 MA made support in the first week of august.
On the daily timeframe, we can see an increase in trading volume.
A death Cross between MA 50 and MA 200 happened on August 10th but at such a low angle (1.36) that it was not really significant.
Today, price is trading above both MAs and remains bullish.
The 4 hours timeframe is showing clear higher lows and higher highs, both on price and RSI.
The parabolic SAR circles are mainly green than red indicating bullish action.
The 2 hours timeframe is plotting a Bullish Pennant, with a target at 69 000.
The Bollinger Bands are indicating that a breakout is likely to happen soon, followed by a big move in price.

CPI PUMP & DUMPClassic price action dynamic surrounding the release of the CPI: A small rise is currently present. As prices are rising before the release, this means the market reaction will be negative after the release.
Rise followed by a crash afterward. As simple as that. Everything is pointing lower. Remember the professional speculators will move contrary to market expectations.
The expectation will be something positive and thus professional traders will end up doing something negative. So we have 1-3 days before the next drop. Add another signal to the list pointing toward to, predicting a Bitcoin crash.
Pretty interesting indeed... So many signals, so many warnings... It is my pleasure to share just a little more with you today.
Thank you for reading. You are appreciated. You are divine. You are loved.
Namaste.

200 week MA unlocks the next bull run.I did a chart on the 200 day awhile back and that was good, so heres another one forecasting a back test of the 200 week MA which will spark the next major bull run in 2025.

A Journey Through Halving Events, Fear & Greed DynamicsMastering Bitcoin’s Market Cycles: A Journey Through Halving Events, Fear & Greed Dynamics, and FOMO Surges
Hello everyone,
Over the years, I’ve dedicated countless hours to studying Bitcoin’s price movements across multiple timeframes, focusing on the interplay between supply and demand, greed and fear, and the ever-pivotal halving cycles. From my earliest analysis in April 2019, where I laid out the foundational trendlines and the importance of the halving setup, to the more recent explorations of Bitcoin’s FOMO Cycles, I’ve sought to decode the complex mechanisms driving this revolutionary asset.
The Foundation: April 2019 Analysis
In April 2019, I introduced a chart that I considered to be the ultimate guide for understanding Bitcoin’s long-term trendlines, grounded in historical price action, key resistance levels, and the RSI (Relative Strength Index) as a measure of market sentiment. This chart underscored the importance of major resistance levels at $6,000, $8,500, and $10,000 USD—critical zones that needed to be "eaten" before the next halving to validate the bullish thesis.
You can view the original chart below this description and also in the comment section.
. This chart successfully predicted the major price movements leading up to the 2020 halving, proving the strength of using historical resistance levels and market sentiment to forecast Bitcoin’s behavior.
At the time, I emphasized that approximately 80% of all Bitcoin had already been mined, with a significant portion of that supply likely lost forever. This supply scarcity, combined with the halving cycle reducing the inflow of new coins, set the stage for future price appreciation. My analysis hinged on the idea that supply and demand dynamics, coupled with investor psychology, drive cyclical market behavior—an idea that continues to hold true today.
Revisiting the Halving Cycles: The Key to Predicting Future Moves
Fast forward to July 2022, and I revisited the concept of Bitcoin’s halving cycles with an updated analysis that sought to replicate the forecasting success of the past. This time, I focused on how the halving cycle—where block rewards for mining are cut in half every four years—plays a crucial role in Bitcoin’s price formation. Each halving event historically leads to a significant supply shock, which, combined with increasing demand, often triggers major bull markets.
The Emergence of FOMO Cycles: Understanding Sentiment-Driven Surges
Building on these concepts, I introduced the idea of FOMO Cycles—phases within Bitcoin’s broader halving cycle characterized by explosive, fear-driven price surges. These FOMO Cycles represent the moments when Bitcoin transitions from periods of consolidation or decline into rapid growth, driven by a market-wide fear of missing out on the next big rally.
Here’s how these cycles typically unfold:
Pre-Halving Accumulation: In the months leading up to a halving, smart money begins accumulating Bitcoin, anticipating the reduced supply. This phase often goes unnoticed by the broader market but sets the groundwork for the upcoming FOMO Cycle.
Halving and Media Hype: As the halving approaches, media coverage intensifies, drawing more retail investors into the market. This increased attention marks the beginning of the FOMO Cycle, as more investors rush to buy Bitcoin before prices skyrocket.
Post-Halving Surge: Following the halving, the reduced supply, combined with increasing demand, often leads to an exponential price increase. This is the peak of the FOMO Cycle, where prices can reach new all-time highs in a relatively short period.
Correction and Consolidation: After the initial surge, the market typically experiences a correction as early investors take profits. Understanding this phase is crucial for managing risk and locking in gains before the market corrects.
Tools and Strategies for Navigating Bitcoin’s Cycles
To help you make the most of these market cycles, I’ve refined several key tools and strategies:
Fear & Greed Index: This indicator provides a real-time measure of market sentiment, helping to identify when fear or greed is dominating the market. Extreme fear often signals a buying opportunity, while extreme greed can indicate that a correction is near.
On-Chain Analysis: By analyzing on-chain metrics such as active addresses, transaction volume, and miner outflows, you can gain insights into the behavior of different market participants and anticipate potential shifts in market dynamics.
RSI Divergence: Watching for divergences between price action and the RSI can help identify moments when the market is overbought or oversold.
Historical Context and Future Implications
By looking back at the April 2019 analysis and comparing it with more recent developments, we can see how these cycles repeat over time, driven by the same underlying forces of supply and demand, amplified by investor psychology. As we approach the next halving in April 2024, understanding these patterns could provide valuable insights into Bitcoin’s future price movements.
Whether you’re a long-term investor or a short-term trader, mastering these cycles is essential for navigating Bitcoin’s volatile market. By combining technical analysis with a deep understanding of market psychology, you can position yourself to capitalize on the next big move while managing your risk effectively.
Final Thoughts and Historical Successes
Looking back at the historical context and the successes of my previous predictions, it’s clear that understanding Bitcoin’s market cycles—especially in the context of halving events and FOMO surges—can provide valuable insights for both short-term traders and long-term investors. By combining these technical insights with an awareness of macroeconomic factors, you can position yourself to capitalize on the next big move in the market.
Whether you’re a long-term investor or a short-term trader, mastering these cycles is essential for navigating Bitcoin’s volatile market. And as always, while this analysis is a powerful tool, remember to stay informed, stay patient, and enjoy the journey.
Disclaimer: This analysis is an attempt to predict future price movements based on historical data and technical indicators. It is not financial advice. Please do your own research and consult with a financial advisor before making any investment decisions.
Chachain

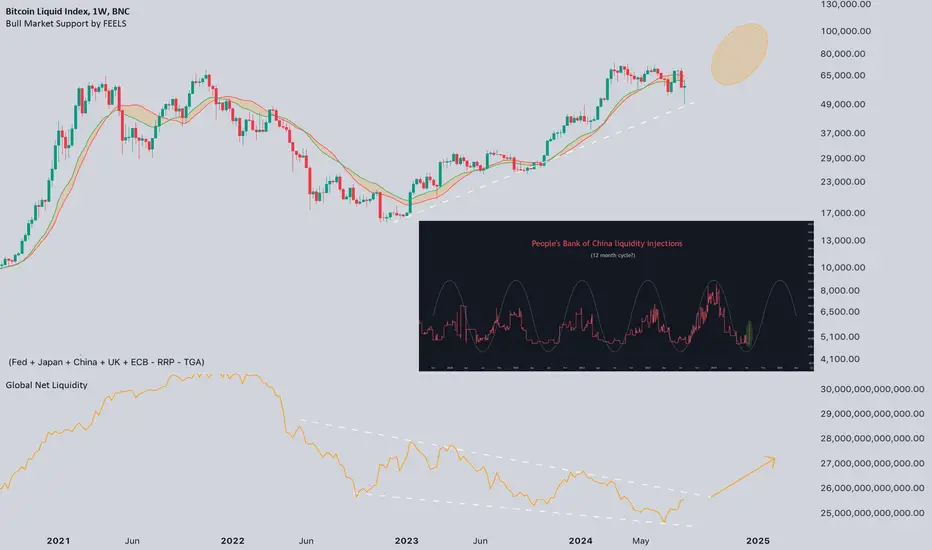
Global Liquidity and BTCWhat's the deal with Global Liquidity?
We all know that Global Net Liquidity plays a crucial role in asset growth, especially for #BTC 📈
🌍 The largest provider of liquidity, the Fed, is expected to lower rates by September, which would boost overall liquidity.
📅 And don't forget the cycles in the world's second-largest economy. Their liquidity injections follow a yearly cycle, with the next one kicking off in October.
For the past 2 years, we have grown against the trend of liquidity, imagine what will happen when liquidity meets us🚀
Dead Cat Bounces for CryptoHello! Today I talk about the current state of BTC, I expect a light upward trend in the short term followed by a long and slow bleed to around 40k for the next 6 months

BLX is halving a restart?I put all the price history into this frame. This cycle does not look out of ordinary so far. Of course assuming this time will be the same is silly nevertheless it is fun to watch how each past cycle was developing day by day from halving point.


BLX Global Final View - BTC - $1 000 000 ?According to Wave Theory:
In the impulses of a wave of the same degree, channelization is observed
2 wave is most often a zigzag
2 wave is most often a deep correction
3 wave equals 1.618*1 wave.
The 3rd wave is the most powerful
4 wave is most often flat according to the rules of alternation
5 wave is mostly equal to 1 wave
BUT
Bitcoin is a commodity market
And in commodity markets, the 5th wave is most often extended.
At what price will YOU exit?

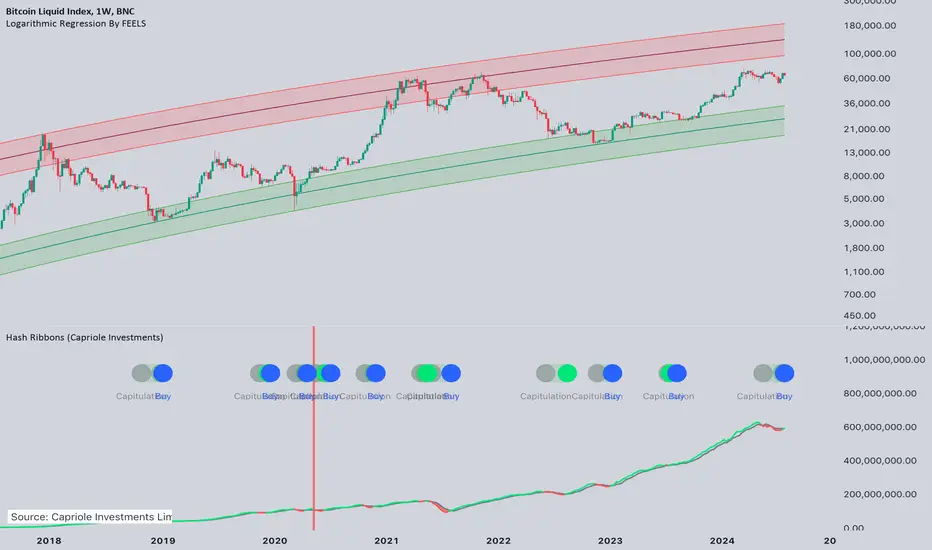
Hash Ribbons - Wrong Signals?🗣: Yesterday we received a buy signal on Hash Ribbons and today we fell, why ⁉️
Answer: The Hash Ribbon is primarily an indicator of the CRYPTOCAP:BTC hashrate, it is 2 moving averages, and when after the capitulation of the miners (after the halving), we reached the plateau at least a little and began to recover, MA turned to the bullish side, which triggered the signal.
📝So it's simple - the hashrate has recovered.
💡Of course, considering other metrics, we have a fairly positive long-term picture and hashrate is a fairly powerful fundamental metric, the growth of which is positive for the reliability of the #Bitcoin network. But too much attention to only one signal is not productive.
Bitcoin Bull/Bear/RecoveryThis chart illustrate the 4-year pattern for bitcoin's price, going through bull, bear and recovery phases.

