BNB Target got hit Mar 8th 2024The main target got hit!
We did trade it from the mid 250s at TTR, now I have exited 25% of my holdings.
Going to buy back at low to mid 300s after the halving event
BNBPERP trade ideas

What's Next?We see that it has completed five ascending waves and two correction waves before it. This indicates that the current shape is a correction and not a real rise, driving all the data shown on the chart.. Goodbye.
*In principle, I am not a supporter of any direction, but I am only giving my point of view, which may be right or wrong. If the analysis helps you, then this is for you. If you do not like this analysis, there is no problem. Just ignore it. My goal is to spread the benefit. I am not one of the founders of the currency.

Preparing to collect BNBPreparing to collect BNB
This quarter 3-4, coin holders are expected to be bustling
BNB is currently accumulating on the daily frame, can have breakdown.
It is also the area where speculators are waiting to collect goods at good prices.

BNB Binance A perfect Target hit !!!This is as perfect as it gets!!!
The TTR target was hit to the penny!
I took off partial of my long-term holdings here. I will be adding at 340-320 level.
There is a potential of hitting 475+ if the price breaks out above today's high

BNB long term targets#BNB #BNB_LTA weekly
price has crossed above 350$ area.
long term targets are found using previous bull and bear market.
important future areas:
1000$ - 1200$
2060$ - 2500$
3600$ - 3900$
7500$

BNB Elliott Wave CountI believe we are at the fourth wave. Retracement is very minimal (currently is always above the 23.6% fibonacci).
$400 is the target. Hold tight

BNB-USD / 15M / TECHNICAL ANALYSIS BINANCE:BNBUSD Hello traders, I have identified the target of the harmonic pattern on the chart.
Like and comment if you find value in our analysis.
Feel free to post your ideas and questions at the comments section.
Good luck

Binance Coin - 10.000% RallyHello Traders, welcome to today's analysis of Binance Coin.
--------
Explanation of my video analysis:
After the break and retest on Binance Coin back in 2020 we saw an insane rally of +10.000% towards the upside. Recently BNB then broke out of a longer term triangle continuation pattern and can now potentially create a similar rally. I am now just waiting for a break and retest of the structure mentioned in the analysis and then I my first target is the previous all time high.
--------
I will only take a trade if all the rules of my strategy are satisfied.
Let me know in the comment section below if you have any questions.
Keep your long term vision.

Binance aims to breach $400, eyes 10% hike
Retest and Breakout Potential: After retesting $350, BNB is projected to run beyond $400, with resistance expected at $440.
Quick Recovery in Altcoins: Despite Bitcoin's slow movement above $50,000, altcoins like BNB are rapidly recovering, placing Binance among today's top performers.
Market Cap Insights: With a $56 billion market cap, BNB is regaining popularity, still at a 45% discount from its all-time high of $690.93.
All-Time High Possibilities: The ongoing bullish reversal improves the chances for BNB to reach new all-time highs.
Technical Analysis: A sharp V-shaped reversal and a rounding bottom pattern with the neckline at $350 indicate strong uptrend support.
Trading Volume and Sentiment: A 7% overnight jump and bullish engulfing candle suggest a solid entry point, with trading volume backing the uptrend continuation.
Current Trading Price: BNB is trading at $379.8, with a Doji candle indicating a brief pause before likely trend continuation.
DMI Indicator: A sharp increase in the ADX line shows a significant spike in trend momentum, supporting the bullish stride.
Short-Term Targets: In the short term, BNB aims to break $400 with eyes on $440 as the initial resistance level.
Long-Term Price Outlook: The 30% price jump in the last 30 days and the momentum beyond $350 suggest a bullish trend continuation, with a potential aim for $700.

BNB/USD - LONGAfter the retracement made on daily timeframe , BINANCE:BNBUSD we are surely going for a long. BINANCE:BNBUSD because after every impulse and correlation follows another impulse

BNB is LongBNB is long till $366 now, keep your SL tight. market has given enough shakeout yesterday

BNBUSD (W) Will wave 5 happen ?BINANCE:BNBUSD
BNBUSD (W) Will wave 5 happen ?
BNBUSD (W) represents a digital currency generated by the BINACE exchange, fostering liquidity through transaction fees levied on retail investors. The question arises as to whether BNB can induce a surge in price amid a potential upswing in the near future, culminating in wave 5 prior to the next correction. Adhere to the strategy and remain vigilant for a favorable entry point should the market unfold as anticipated

BNB Feb 14 UpdateLooking for a strong close and 348 as the next target.
My ideal target stays the same $400, followed by a multi-month correction back to low 300s

BNB Bull about to resume the uptrend?A strong daily close above the upper band flag would suggest bullish interest.
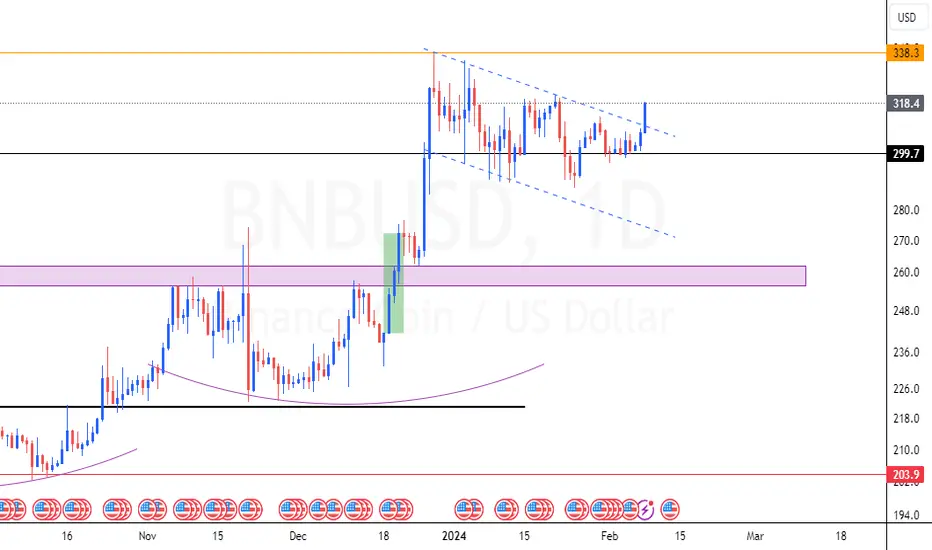
BNB Feb 7 Breakout UpdateSharing one of my favorite #crypto coin update from TTR
We have been tracking it perfectly all the way from Oct lows.
TTR is very long this coin and its on its way for a breakout!
- Bulls must break above 309
- Bears must hold 296
Binance gets associated with China, and I assume it should start to outperform BTC and potentially even ETH into a mid-month high. Saying that - I will start to cut at 371 and above 400 levels.

BNB UPDATEStrong bullish sentiment still active on BNB. A strong day close above the bullish flag would interest more buyers to load more long orders.

Third wave of double zigzag patternDear Friends,
I hope this message finds you well and that you're having a great start to the week. I wish you success in your business endeavors.
As someone interested in the Elliott Wave principle, I find it a valuable tool for analyzing the market. I have developed my approach by combining this principle with my personal experience and by considering various scenarios that are likely to occur in the market.
I am sharing my analysis with you, but please note that I am not providing any buy or sell signals. I aim to share my unbiased analysis with you so that you can use it as a guide to make informed decisions.
In the attachment, you will find my previous analysis of the same market, so you can compare and see the differences. All the details of my analysis are clearly labeled, making it easy for you to understand (although having a basic familiarity with the Elliott Wave Principle theory will help you understand the analytical idea more easily).
I have been studying the Elliott Wave principle for almost three years now. With time, my understanding of this knowledge and experience has increased. What I have achieved so far is a legacy of a genius named Ralph Nelson Elliott, and I am truly satisfied with my progress. May his soul rest in peace and his memory be cherished.
Thank you for your support so far. I am grateful and will always remember your kindness. Please feel free to share your thoughts and feedback with me.
I hope my analysis will be useful to you in your business journey, and I wish you all the best.
Sincerely,

BNB Price Exhibits Reversal Chance Under Market CorrectionSideways Market Movement: BNB exhibits a lateral trend amid a broader market slowdown.
Resilience Above $300: Despite Bitcoin's crash and altcoins' downturn, BNB sustains above the $300 mark.
Potential for a 52-Week High Breakout: A reversal and bounce back from current levels might challenge the yearly high of $352.2.
Recent Price Drop Impact: An overnight 4.08% drop signals possible deeper corrections for short-term BNB traders.
V-Shaped Reversal Under Threat: The recent decline challenges the recent V-shaped recovery from $300.
Overall Bullish Outlook for 2024: Despite current bearish trends, long-term forecasts remain positive.
Current Trading Dynamics: BNB, with a 51% growth in 100 days, shows potential upward momentum.
BNB's Trading Volume: With a significant 24-hour trading volume, Binance maintains its top position in centralized exchanges.
Technical Indicators - MACD: The MACD indicator shows a lack of bullish crossover, highlighting the recent bearish attack.
Recovery Potential This Week: Current intraday growth suggests potential for overcoming the bearish start of the week.
Key Resistance at $320: Overcoming the 78.60% Fibonacci level could propel BNB to the $350 region.
Downside Risks: A continuation of the bearish trend might lead BNB to retest the crucial $300 support level.

BNBUSD Elliott Impulse Wave WeeklyBinance Coin is moving in a bullish channel on the weekly time frame.
If we consider this movement in the form of Elliott impulse wave, the price can move up to the ceiling of the channel.
Target Range 3000-8000

BNB IS VERY BULLISH (1W)Previously, for BNB, we considered a diametric, but the conditions of the waves are such that it seems that we are inside a triangle.
It seems that we are now in the final wave of this triangle, the E wave.
Based on the signals we have on the chart, we think $207 is the absolute bottom for BNB!
By maintaining the key level, which is $207, it can move towards the targets.
Our stop is the close of two weekly candles below $207. Further confirmation is when RSI resistance is broken above

✴️ Binance Coin Short | Final Call (Lev. Trade Setup)I will not say 8X or 10X because the amount of risk or lev. you want to take/use is completely up to you.
I will not say that 255 is an easy target short-term, that is for the market to decide.
I will say though that a new lower high is about to be confirmed on this timeframe, coupled with high volume.
Lower highs since the 28th of December works as a strong bearish signal.
As long as this signal remains in place, we can expect lower prices —the bearish potential is full and active.
Invalidation comes if we get a higher high compared to 3-Jan.
Any trading below this point and the chart setup is bearish.
This is not financial advice.
Do your own research and planning.
Good luck.
Namaste.

My opinion in the 4-hour time frameI think we should wait for the drop to the bottom of the channel from a little higher. To use this chart, go to the 15 M timeframe.

Increased riskIt reached the first goal and gave 40% profit. I think this level will break and move to a higher level.
