Binance Coin Price DiscoveryBinance is set to make ATHs in our estimations.
There is not much to say here, fundamentally all roadblocks at Binance are in the past, and technically we like the chart.
GL
BNBUSDT.P trade ideas

BNB BNB moved down side correction. But this down movements showing bearish momentum. Because BNB sweep the minor swing high (💀) and moved down and closed Bos line.
Order block (2) is next resistance zone. If this zone was fail, BNB moving up.
Order block (1) is next support zones.

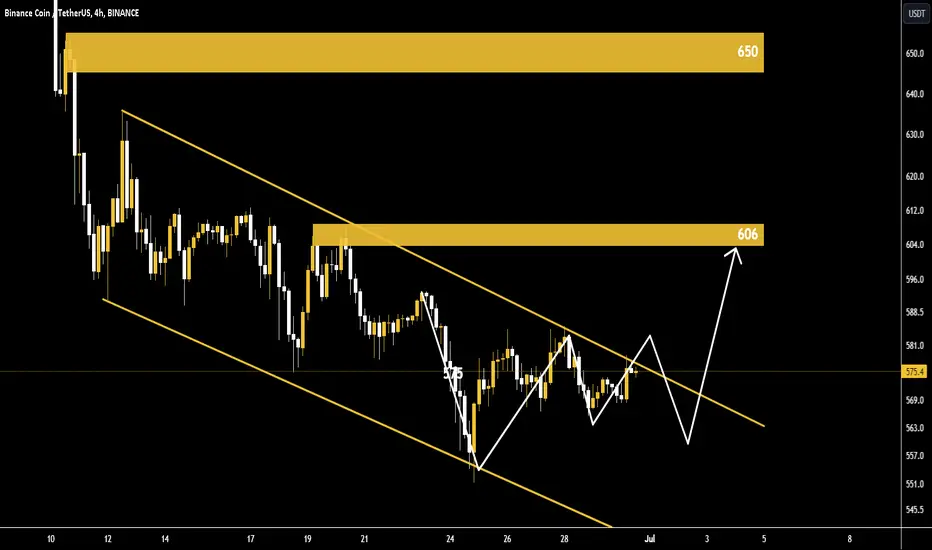
Is Binance Coin Breaking Out of its Bearish Pattern?📊Due to the decrease in the downward momentum of the price movement, if the range of 580 units is broken and the price stabilizes above it, the price may increase to the range of 590 units🎯, and in the case of the strength of the range of 606 units🎯🎯.
📊Otherwise, the price may fall to the range of 555 units.
BNB BNB sweep the swing low (💀) and moved higher. Currently facing order block (a). BNB chart showing clearly bearish momentum. So this order block (a) was not high probability.
Order block (2) was next support zone.

BNB BNB failed in order block (3). Sweep the swing low (💀) and moved up. BNB chart showing bearish momentum. Because Order block (1) was not failed. BNB mitigated this orderblock (1) and moved down.
So BNB moving down side is possible. Order block (2) was next support zone.

Long trade 27th June 24
19.30pm
New York Session
15min TF Structure
5min Entry
Entry 580.79
Profit level 582.09 (0.22%) 130 PIPS
Stop level 580.11 (0.12%) 68 PIPS
RR 1.91

BNB BNB has bullish. BNB mitigated this orderblock (1) and moved down and took the Inducement (💎2) and moved higher. But not closing this Bos line. Only sweep. So BNB moving down side.
Next BNB took the inducement (💎3) or mitigate orderblock (3) and moving up side is possible.

BNB still a Monthly bullflag. Adding an Hourly Higher low. BNB failed the Monthly bullflag break due to BTC W consolidation.
Lets see if Bullls can regain control after a retest of the Value Area.
Fishing an Hourly Higher low for a backside entry.

Update on BNB BNB on the daily chart failed to continue uptrend after completing to form Adam and Eve pattern. So I expect BNB to go down to $200.

BNB - trading planBNB - trading plan
Trend is down
i think price should take LOW of previous value $500 area
best trade for SHORT would appear if price re-test 620 - 630 area
Longs i`ll take after big SL hunts
Watch full update to understand what to do

BNB BNB mitigated this orderblock (1) and moved down. Currently BNB Chart showing sell side moves. Order block (a) was minor resistance.
Order block (2) was next support zone.

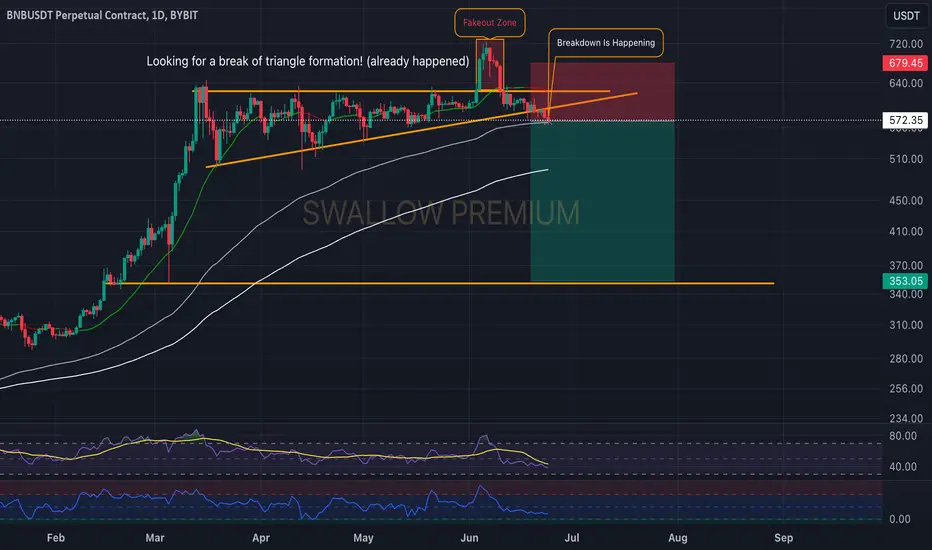
Binance Coin (BNB): Breaking Drown from Triangle Formation!BNB has broken down from triangle formation, leading the price towards 100 EMA (which we are looking to be broken).
As soon as we see a breakdown from 100EMA, we should see a further downward movement towards 200EMA and the local support zone as well!
Swallow Team
BNB BNB mitigated order block (1) and moved down. So some down side move possible. Currently facing small support zone (3). If this zone was fail, BNB moving downside.
Order block (2) was next support zone.

BNBBNB prices still pushing down, so I’m looking to go shots in the yellow zone. I might look for one hour candle stick close bearish then I will take this trade. This is my point of view, Do your homework and be patient. Good luck people ;)

BNB/USDT 1D Chart ReviewHello everyone, I invite you to a quick review of the BNB to USDT chart on a 1-day time frame. As you can see, the price broke the bottom of the upward trend line.
As we can see after unfolding the Fib Retracement grid, the price is approaching the strong support level of $540, but if this support is broken we will still be at the level of $490.
Looking at the second stone, again using the Fib Retracement grid, we will see the first resistance at $616, then the second one at $658, and then the price may increase to around $723.
Looking at the STOCH indicator, you can see that it was moving along the lower border, which may give an attempt to rebound the price.

BNB BNB currently took the Inducement (💎). Overall market was bearish. So down side move possible.
Order block (1) was next resistance zone. Order block (2) was next support zone.

BNB - Ranges overview (update)BNB moving nicely and like we noted it in the previous weeks.
We closed back within the range and we are currently trading towards the lows of the range and the liquidity sitting around 540$ and 520$
Will be interesting to see how we end the week in the overall crypto market.
BTC is currently below its range lows so let’s see where we move from here…you’ll notice most cryptos as always simply mimick and follow BTC.
Stay safe and never risk more than 1-5% of your capital per trade. The following analysis is merely a price action based analysis and does not constitute financial advice in any form.

BNBUSDT shortMe, waiting for BNB to reach 418. Break of structure since March made me go on this bias, May also shows next BOS that made me re-enter this trade. 700ish if price broken will invalidate my plan to short.

BNB BNB mitigated this orderblock (3) and moved higher. Next BNB mitigated this orderblock (1) and moved down. Order block (3) is the last support zone. This zone failed. This shows that BNB is bearish.

A 800% move to $6000 for Binance token (BNB) by September?On the above monthly chart of BNB token there is easily an hour of topic to discuss. However attention spans amongst the equity providers do not afford a detailed explanation so the short version..
1) Price action is in a legacy uptrend channel since inception with a confirmation of uptrend continuation (unlike LTC).
2) Price action is at resistance after three years of consolidation. This is the third test of resistance. Blue pointing down arrows.
3) Just as with May 2020 prior to the break of resistance, Stochastic RSI previously crossed above 80. (orange arrows). This is the same situation as today. Stochastic RSI remains with momentum for 182 days. Should history repeat, momentum continues until August / September.
4) The bull flag pattern confirms a breakout AND support. A measured move from the flagpole of the last resistance breakout takes price action to $6000.
Is it possible price action corrects? Sure.
Is it probable? No.
Ww
Type: trade
Risk: <=6%
Timeframe for long: You decide
Return: 800% over the next 16 weeks

BNB - 580$ long entryPretty sure we will see another drop into 580$ coming hours, which should print this weeklys low. But I have to say I'm not interested in holding this position for too long (weeks to months).
BNB looked good after the breakout of the ascending triangle and I had a target of 1000$ (which could still happen), but I don't like the deep retest we are seeing right now, so just a swing trade for me :)
Stay safe!

Long trade 23rd June 24
10.58 pm
Tokyo Session
Buyside
15min TF entry
Entry 589.05
Profit level 596.43 (1.25%)
Stop level 588.01 (0.18%)
RR 7.1
Thought process
Trending inside the range
Phase C - Whykoff method

BNB BNB mitigating orderblock (3) to moving upside. This order block was last support zone. Currently facing order block (1) resistance zone.
Order block (4) is next support zone. Currently BNB Chart showing strong upside momentum. So BNB moving more upside possible.
