BNB: Poised to Resume Bullish TrendBNB Poised to Resume Bullish Trend
Since February 13, BNB has experienced a month-long decline, entering a clear 4-hour bearish trend. However, the price appears to have completed a "Descending Channel" pattern, signaling a potential shift.
Currently, BNB is demonstrating renewed strength. A decisive move above the descending channel could propel BNB upwards, with an initial target of 625 and a secondary target of 670.
You may watch the analysis for further details!
Thank you:)
BNBUSDT trade ideas

BNB: Navigating the Current DipBNB: Navigating the Current Dip 📉🔍
The crypto market is always in flux, and right now, BNB is showing signs of a downward trend. However, it's not all doom and gloom. Let's break down the situation.
The Current Scenario 📉:
BNB is currently experiencing a downward trajectory. Despite this, it's crucial to acknowledge that the coin has maintained a pattern of higher lows and higher highs. This suggests that the current dip might be a temporary sideways correction before BNB aims for the $650 mark in the near future.
Key Technical Analysis 📊:
Fibonacci Levels: BNB is currently within the Fibonacci retracement levels of $629.7 to $638.6. These levels are significant indicators of potential support and resistance.
Support and Resistance:
A strong support level has been observed at $630.9.
Potential resistance is identified at $637.2.
Statistical Analysis: This analysis is based on robust statistical modeling, specifically the VAR (Vector Autoregression) model, which helps in understanding the interdependencies between multiple time series data. This adds a layer of reliability to the prediction.
Understanding the Trends 🤔:
The fact that BNB is maintaining the pattern of higher lows and higher highs indicates that the overall bullish trend might still be intact. The current dip could be a temporary phase of consolidation before the next upward surge.
The $650 Target 🎯:
The analyst predicts that BNB is likely to aim for the $650 price point in the near term. This prediction is based on the analysis of current trends and historical data.
The Next 12 Hours ⏳:
The next 12 hours are critical. We'll be closely monitoring how BNB interacts with the identified support and resistance levels. Any significant break above or below these levels could indicate the direction of the next major move.
Important Considerations ⚠️:
The crypto market is highly volatile.
Always conduct your own research before making any investment decisions.
Market fluctuations are possible.
In Conclusion 🌟:
While BNB is currently on a downward trend, the overall outlook remains cautiously optimistic. The identified support and resistance levels, combined with the statistical analysis, provide valuable insights into potential future movements. Let's keep a close eye on BNB in the next 12 hours to see how things unfold.
I hope this breakdown provides a clear picture of the current BNB situation! 🚀
What do you think, friends?

Magic of statistical models and mathematics Hey everyone! 👋 I wanted to share some of the magic of statistical models and mathematics with you. ✨ Check out how price reacts to Fibonacci levels, those levels are determined by using the VAR statistical model. 📊
It's amazing how numbers and patterns can reveal hidden insights in the market! It's like watching a secret code unfold right before our eyes. 🤩 The way price respects those Fibonacci levels is truly fascinating. It's a testament to the power of these models and the beauty of mathematics. 🤓
Enjoy the show! 🍿

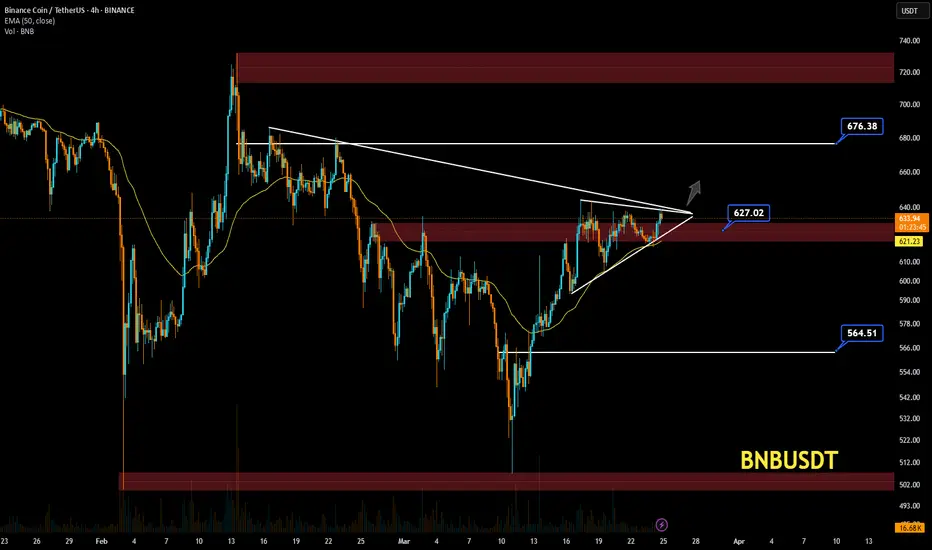
BNBUSD BNBUSD Price Action Analysis – 4H Timeframe 📊🔥
Market Structure:
The chart shows a symmetrical triangle pattern forming, with the price approaching a breakout. 📈🔺
Supply and demand zones are marked with red boxes, indicating key levels for reaction. 🟥
The price is currently testing the $627.02 resistance level. 🚀
Trend Analysis:
A Higher Low (HL) was recently formed at $564.51, maintaining the bullish trend. 🔼
The 50 EMA at $621.21 acts as a strong dynamic support. 📉
Increasing volume suggests a potential breakout. 📊
Key Levels:
Resistance:
The $627.02 - $630 area is a critical supply zone. If broken, the next target would be $676.38. 🎯
A breakout above this level could confirm strong bullish momentum. 🟢
Support:
The $621.21 level, aligning with the 50 EMA, serves as a key support. 📉
If this level breaks, a potential decline toward $564.51 is possible. ⚠️
Possible Scenarios:
🔹 Bullish Case: A confirmed breakout above $627 could push the price toward $676. 🚀
🔹 Bearish Case: Rejection from resistance and a break below $621 may lead to a drop to $564. ❌
📌 Conclusion:
Watching for breakout confirmation before making any decisions. 🔎
Key levels: $627 (resistance) and $621 (support). 📍
Volume and price action will determine the next move. 📊
BNB/USDT:BUY LIMITHello friends
You can see that after the price fell, buyers entered the specified support area and supported the price and created higher ceilings and floors.
Now we can buy at the specified levels with capital and risk management and move to the specified targets.
*Trade safely with us*

BNB usdt - near to breakout After Breakout confirmation target is 830
If reject from here then lower levels are 618
560 510

BNB Price Outlook in the Next 12 Hours!🚀 BNB Price Outlook in the Next 12 Hours! 🔥
Hey crypto enthusiasts! 🌍💰 Let's dive into the latest BNB price action and key levels to watch over the next 12 hours. 📉📈
🔹 Resistance Level: $629.4 🚧
🔹 Support Level: $613.5 🛡️
🔹 Fibonacci Levels: $620.8 - $625.9 📊
With these crucial levels in play, where do you think BNB is headed? 🤔 Will we see a breakout above resistance or a retest of support? Share your thoughts and analysis in the comments! 🔥👇
#BNB #Crypto #Trading #Analysis 🚀

Witness Magic of Statistical Models in Harmony with FibonacciWitness the Magic of Statistical Models in Harmony with Fibonacci Levels! ✨📊
Have you ever seen mathematical beauty unfold right before your eyes? 🤯 Imagine the elegance of statistical models perfectly aligning with Fibonacci levels—it's like witnessing a symphony of numbers! 🎶🔢
Fibonacci sequences, deeply rooted in nature and financial markets alike, provide a powerful tool for identifying key price levels. 📈✨ When combined with robust statistical models, they unveil patterns that might otherwise go unnoticed. The result? A mesmerizing blend of logic and intuition, precision and prediction! 🎯🔮
📌 Why is this combination so fascinating?
✅ Predictive Power – Fibonacci levels help anticipate market trends, while statistical models refine those predictions. 📊🔍
✅ Data-Driven Accuracy – Instead of relying on guesswork, this approach leverages solid mathematical foundations. 🏗️📈
✅ Aesthetic Elegance – There's something truly captivating about seeing numbers align so seamlessly! ✨🔢
So, what do you think of this remarkable harmony? 🤩 Let’s discuss in the comments! ⬇️

Analysis of Price Movements Using Fibonacci RetracementAnalysis of Price Movements Using Fibonacci Retracement 📊📈
In the current market analysis, the price level of $626 is identified as a key resistance area. This conclusion is derived from statistical analysis and mathematical models. Let’s dive into the details:
Key Observations 🔍
Resistance at $626: Based on Fibonacci retracement levels, $626 represents the 50% retracement level. This makes it a critical zone where price action is likely to face resistance.
Projected Price Movement: The analysis suggests that the price will likely move downward toward the range of $619 - $612.5 before any significant reversal occurs.
Fibonacci Levels:
The retracement levels between $619.6 and $633.5 are crucial for understanding potential support and resistance zones.
The 50% level at $626 aligns with market psychology, making it a pivotal point for traders.
Conclusion 🧮
The price is expected to decline to the range of $619 - $612, followed by a potential rebound toward $640 🚀.
Traders may consider this movement as an opportunity to plan their entries and exits strategically.
Final Thoughts 💡
This analysis highlights the importance of Fibonacci retracement levels in predicting market behavior. The 50% level, in particular, serves as a strong indicator of potential reversals or continuations in price trends.
What do you think? 🤔

Who's with me on this?I predict BNB is about to make a historic surge, blowing past expectations and reaching $900+ very soon! 🚀📈 Who's with me on this? #BNB #Crypto #Bullish 💰


BNB the turn of the EMPIRE OF EXCHANGE , claiming the POWERBNB the turn of the EMPIRE OF EXCHANGE , claiming the POWER
Prepare the seat belt again

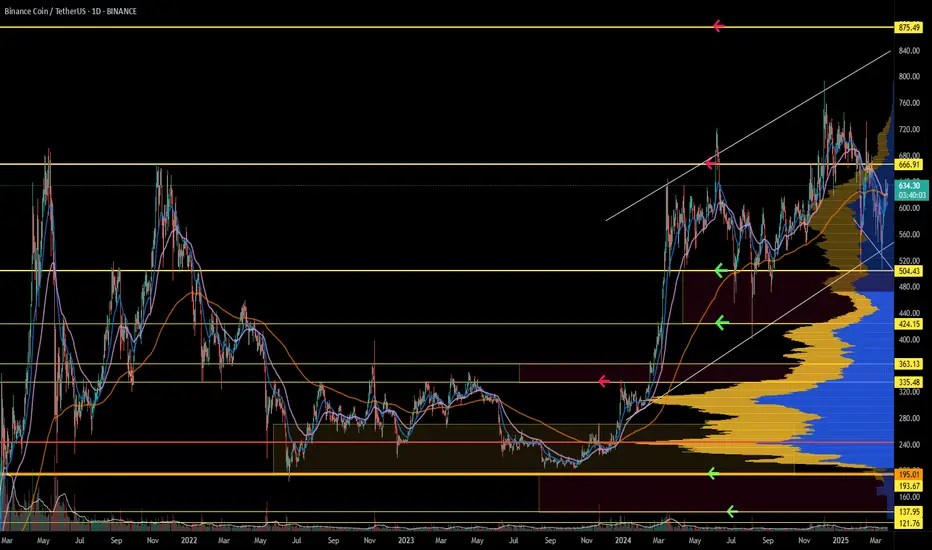
BNB/USDT Daily Chart Update. BNB remains inside a descending channel, facing resistance at the upper boundary.
Ichimoku Cloud Resistance: The price is struggling to move above the red Ichimoku Cloud, which may indicate continued bearish pressure.
100MA Rejection: The 100-day moving average (purple line) acts as a strong dynamic resistance.
Bearish Scenario:
If the rejection persists, BNB could drop towards $500-$480, which aligns with the lower channel support.
A confirmed breakdown would extend losses towards $450 and lower.
Bullish Breakout:
A breakout above $663 and the 100MA would increase momentum, potentially targeting $750-$800. A breakout of the descending channel would confirm a trend reversal.
If you found this analysis helpful, hit the Like button and share your thoughts or questions in the comments below. Your feedback matters!
Thanks for your support!
DYOR. NFA

BNB looks still in an uptrend while the rest of the market looksBNB is still in an uptrend here while testing the bottom of the demand line. The question is can it hold?
There is a volume gap below to be aware of however horizontal support is being respected while the market shows weakness.
Full TA: Link in the BIO
BNB/USDT 1D chart, target and stop-lossHello everyone, let's look at the 1D BNB chart to USDT, in this situation we can see how the price came out of the top of the ongoing downward trend.
Going further, let's check the places of potential target for the price:
T1 = $ 646
T2 = $ 683
Т3 = $ 732
Let's go to Stop-Loss now in case of further declines on the market:
SL1 = $ 592
SL2 = $ 558
SL3 = $ 535
SL4 = $ 505
Looking at the RSI indicator, we see
As we entered the upper part of the range again, however, there is still a place for the price to go higher, giving more targets.

BNB ANALYSIS🚀#BNB Analysis : Pattern Formation
🔮As we can see in the chart of #BNB that there is a formation Inverse Head And Shoulder Pattern and it's a bullish pattern. If the candle closes above the neckline then a bullish move could be confirmed✅️
🔰Current Price: $635
⚡️What to do ?
👀Keep an eye on #BNB price action. We can trade according to the chart and make some profits⚡️⚡️
#BNB #Cryptocurrency #TechnicalAnalysis #DYOR

Be careful with BNB !!!the price can form a head and shoulders pattern. If that is happen, expect a significant price increase.
Give me some energy !!
✨We spend hours finding potential opportunities and writing useful ideas, we would be happy if you support us.
Best regards CobraVanguard.💚
_ _ _ _ __ _ _ _ _ _ _ _ _ _ _ _ _ _ _ _ _ _ _ _ _ _ _ _ _ _ _ _
✅Thank you, and for more ideas, hit ❤️Like❤️ and 🌟Follow🌟!
⚠️Things can change...
The markets are always changing and even with all these signals, the market changes tend to be strong and fast!!

BNB/USDTBNB$ pascal hard fork today and holding well above the 200-day EMA.
_ Expect a 10%-20% pump from here.

The Calm Before the Moonshot?
BNB remains in a strong uptrend, maintaining higher highs and higher lows while staying above the bullish EMA ribbon. However, short-term momentum is bearish, making the support zone between $507 and $454 an optimal entry point for those looking to position themselves in the trend continuation. This area has historically acted as a strong demand zone, increasing the probability of a rebound.
If buyers step in and the price holds this level, the next targets are projected based on the current channel’s size, with potential upside levels at $1,165 and $1,640. This aligns with the broader bullish structure, offering an attractive risk-to-reward setup.
Traders should wait for confirmation of a reversal on LTF before entering long positions. If BNB maintains its structure within the channel, this could provide a solid opportunity for continuation.
👨🏻💻💭 Are you watching this level for a potential entry? Let me know your thoughts.
__
The information and publications within the 3Commas TradingView account are not meant to be and do not constitute financial, investment, trading, or other types of advice or recommendations supplied or endorsed by 3Commas and any of the parties acting on behalf of 3Commas, including its employees, contractors, ambassadors, etc.

The Real Magic Behind Fibonacci Retracement Levels and StatisticProfessional Analysis: The Real Magic Behind Fibonacci Retracement Levels and Statistical Models in Financial Markets 🌟
In the world of financial market trading, where chaos intertwines with opportunity, talking about "real magic" might sound a bit strange. But let me clarify what I mean. Real magic isn’t just an optical illusion or a random guess—it’s mathematics and numbers when used systematically and thoughtfully. One of the most striking examples of this is the combination of Fibonacci retracement levels and statistical models to analyze price movements. If you doubt it, let’s take a look at the chart in front of us and see how these tools unfold in reality. 📊
Fibonacci Levels: Order Within Chaos 🔢
Fibonacci retracement levels, derived from the famous mathematical sequence, are a powerful tool for identifying potential support and resistance zones in markets. When we apply these levels to a price chart, such as that of the BNB coin, for instance, something astonishing emerges: the price reacts to these levels repeatedly and noticeably. Why? Because these levels aren’t random lines—they reflect natural ratios that the market tends to respect, based on traders’ behavior and underlying mathematical dynamics. ✨
Take a close look at the chart. You’ll notice how the price bounces or pauses at levels like 38.2%, 50%, or 61.8%. This interaction isn’t a coincidence—it’s evidence that numbers, when used intelligently, can reveal hidden patterns in market movements. 👀
The Fair Price and the Black Line: The Statistical Compass 📈
Now, let’s move to another element in the chart: the black line representing the "fair price" of BNB over a 12-hour timeframe. This line isn’t just a visual decoration—it’s the result of an advanced statistical model that considers price averages, volatility, and historical trends. What’s truly remarkable is how the price moved toward this line, as if drawn to it magnetically. This reflects the power of statistical analysis in predicting equilibrium points that the market strives to reach after periods of fluctuation. 🧲
Why It’s Not Easy, But Not Impossible Either ❓
Let me be clear: predicting price movements in financial markets isn’t an easy task. The market is full of variables—news, sentiment, and unexpected interventions. But that doesn’t mean prediction is impossible. By using tools like Fibonacci levels alongside advanced mathematical and statistical models, we can narrow the circle of uncertainty and identify probable trends over specific periods, such as 12 hours in this case. ⏳
What I want to emphasize is that success in this field doesn’t rely on luck or guesswork, but on a deep understanding of mathematical tools and their logical application. The chart before you is living proof of that: a blend of Fibonacci and statistics reveals a stunning connection between numbers and price action. 💡
Watch the Chart and Enjoy 😊
In conclusion, I invite you to look at the chart again. Enjoy the beauty of numbers manifesting in market movements. The real magic isn’t in mystery—it’s in the ability to decode chaos using mathematics. Whether you’re a professional trader or an enthusiast, always remember: the tools are there, the knowledge is accessible, and the results are achievable. All you need to do is watch, learn, and enjoy the journey. 🎉

Dialogue on Determining the Fair Value of CryptocurrenciesDialogue on Determining the Fair Value of Cryptocurrencies 💬📊💰
Analyst: "Hello! 👋 Today, let's discuss how to determine the fair value of cryptocurrencies, especially BNB and BTC, using statistical and mathematical models." 📈📉
Investor: "That's a very important topic! 🤔 I've heard that market volatility makes it difficult to pinpoint fair value." 🎢
Analyst: "That's true, but statistical and mathematical models help us mitigate those difficulties. 🛠️ For instance, we can use time series models like ARIMA (AutoRegressive Integrated Moving Average) to predict BNB and BTC prices based on historical data." 🕰️📈
Investor: "And how exactly does the ARIMA model work?" 🧐
Analyst: "The ARIMA model analyzes patterns in historical data, such as seasonality and fluctuations, and forecasts future prices based on these patterns. 📝 We can apply this model to historical BNB and BTC price data to determine a potential price range." 📊
Investor: "Are there other useful models?" 🧐
Analyst: "Of course! Regression models are also beneficial. 📊 We can use them to analyze the relationship between various factors and their impact on BNB and BTC prices. For example, we can analyze the relationship between trading volume, market news, and other cryptocurrency prices to determine their effect on BNB and BTC." 📰📈
Investor: "What about machine learning models? Can they be used?" 🤖
Analyst: "Yes, machine learning models, such as neural networks, can be very powerful in analyzing large amounts of data and discovering complex patterns. 🧠 We can train these models on historical BNB and BTC data to determine the most influential factors on prices and estimate fair value." 💻
Investor: "Can you give me a concrete example?" ✍️
Analyst: "Let's say we analyzed BNB data using an ARIMA model and found that the model predicts BNB's price will move within the $600-$850range next month, with an 80% probability. 📈 This gives us an estimate of BNB's fair value based on historical data." 💰
Investor: "And what about BTC?" ₿
Analyst: "For BTC, we can use more complex models due to the large data volume. For example, we can use Monte Carlo models to estimate the probability of different outcomes by simulating multiple scenarios based on factors like trading volume, hash rate, and market news." 🌐🔮
Investor: "How do we verify the accuracy of these models?" ✅
Analyst: "We can use techniques like model validation and performance evaluation to ensure the models provide accurate predictions. 🔬 We can also compare model results with actual data to assess their accuracy." 📊✔️
Investor: "Thank you, this clarifies how statistical and mathematical models can be used to determine the fair value of cryptocurrencies." 🙏
Analyst: "You're welcome! 😊 Remember that these models are useful tools, but they're not perfect. 🛠️ They should always be used in conjunction with fundamental analysis and an understanding of market factors." 🧠📈

BNBUSDT BuyBinance coin has consolidation on H4 chart, between 560 - 630 levels. now price is on the resistance and tries to break it to reach 690 level. Risk reward 1/2

BNBUSDT short term targetsTariffs, war, Inflation ,FED rule the markets
Short term trend line broken
Entry1:
aggressive entry
Entry2: waiting for pullback to enter
Entry3:
Entry aggressive (Buy1), if pullback we add 2nd position.
If no pullback, no additional position.
Profit targets are the same for both approaches
